
In the rapidly evolving landscape of renewable energy and electric vehicles, efficient battery management systems (BMS) play a pivotal role in optimizing performance, extending battery life, and ensuring overall system reliability.
Brief About JKBMS
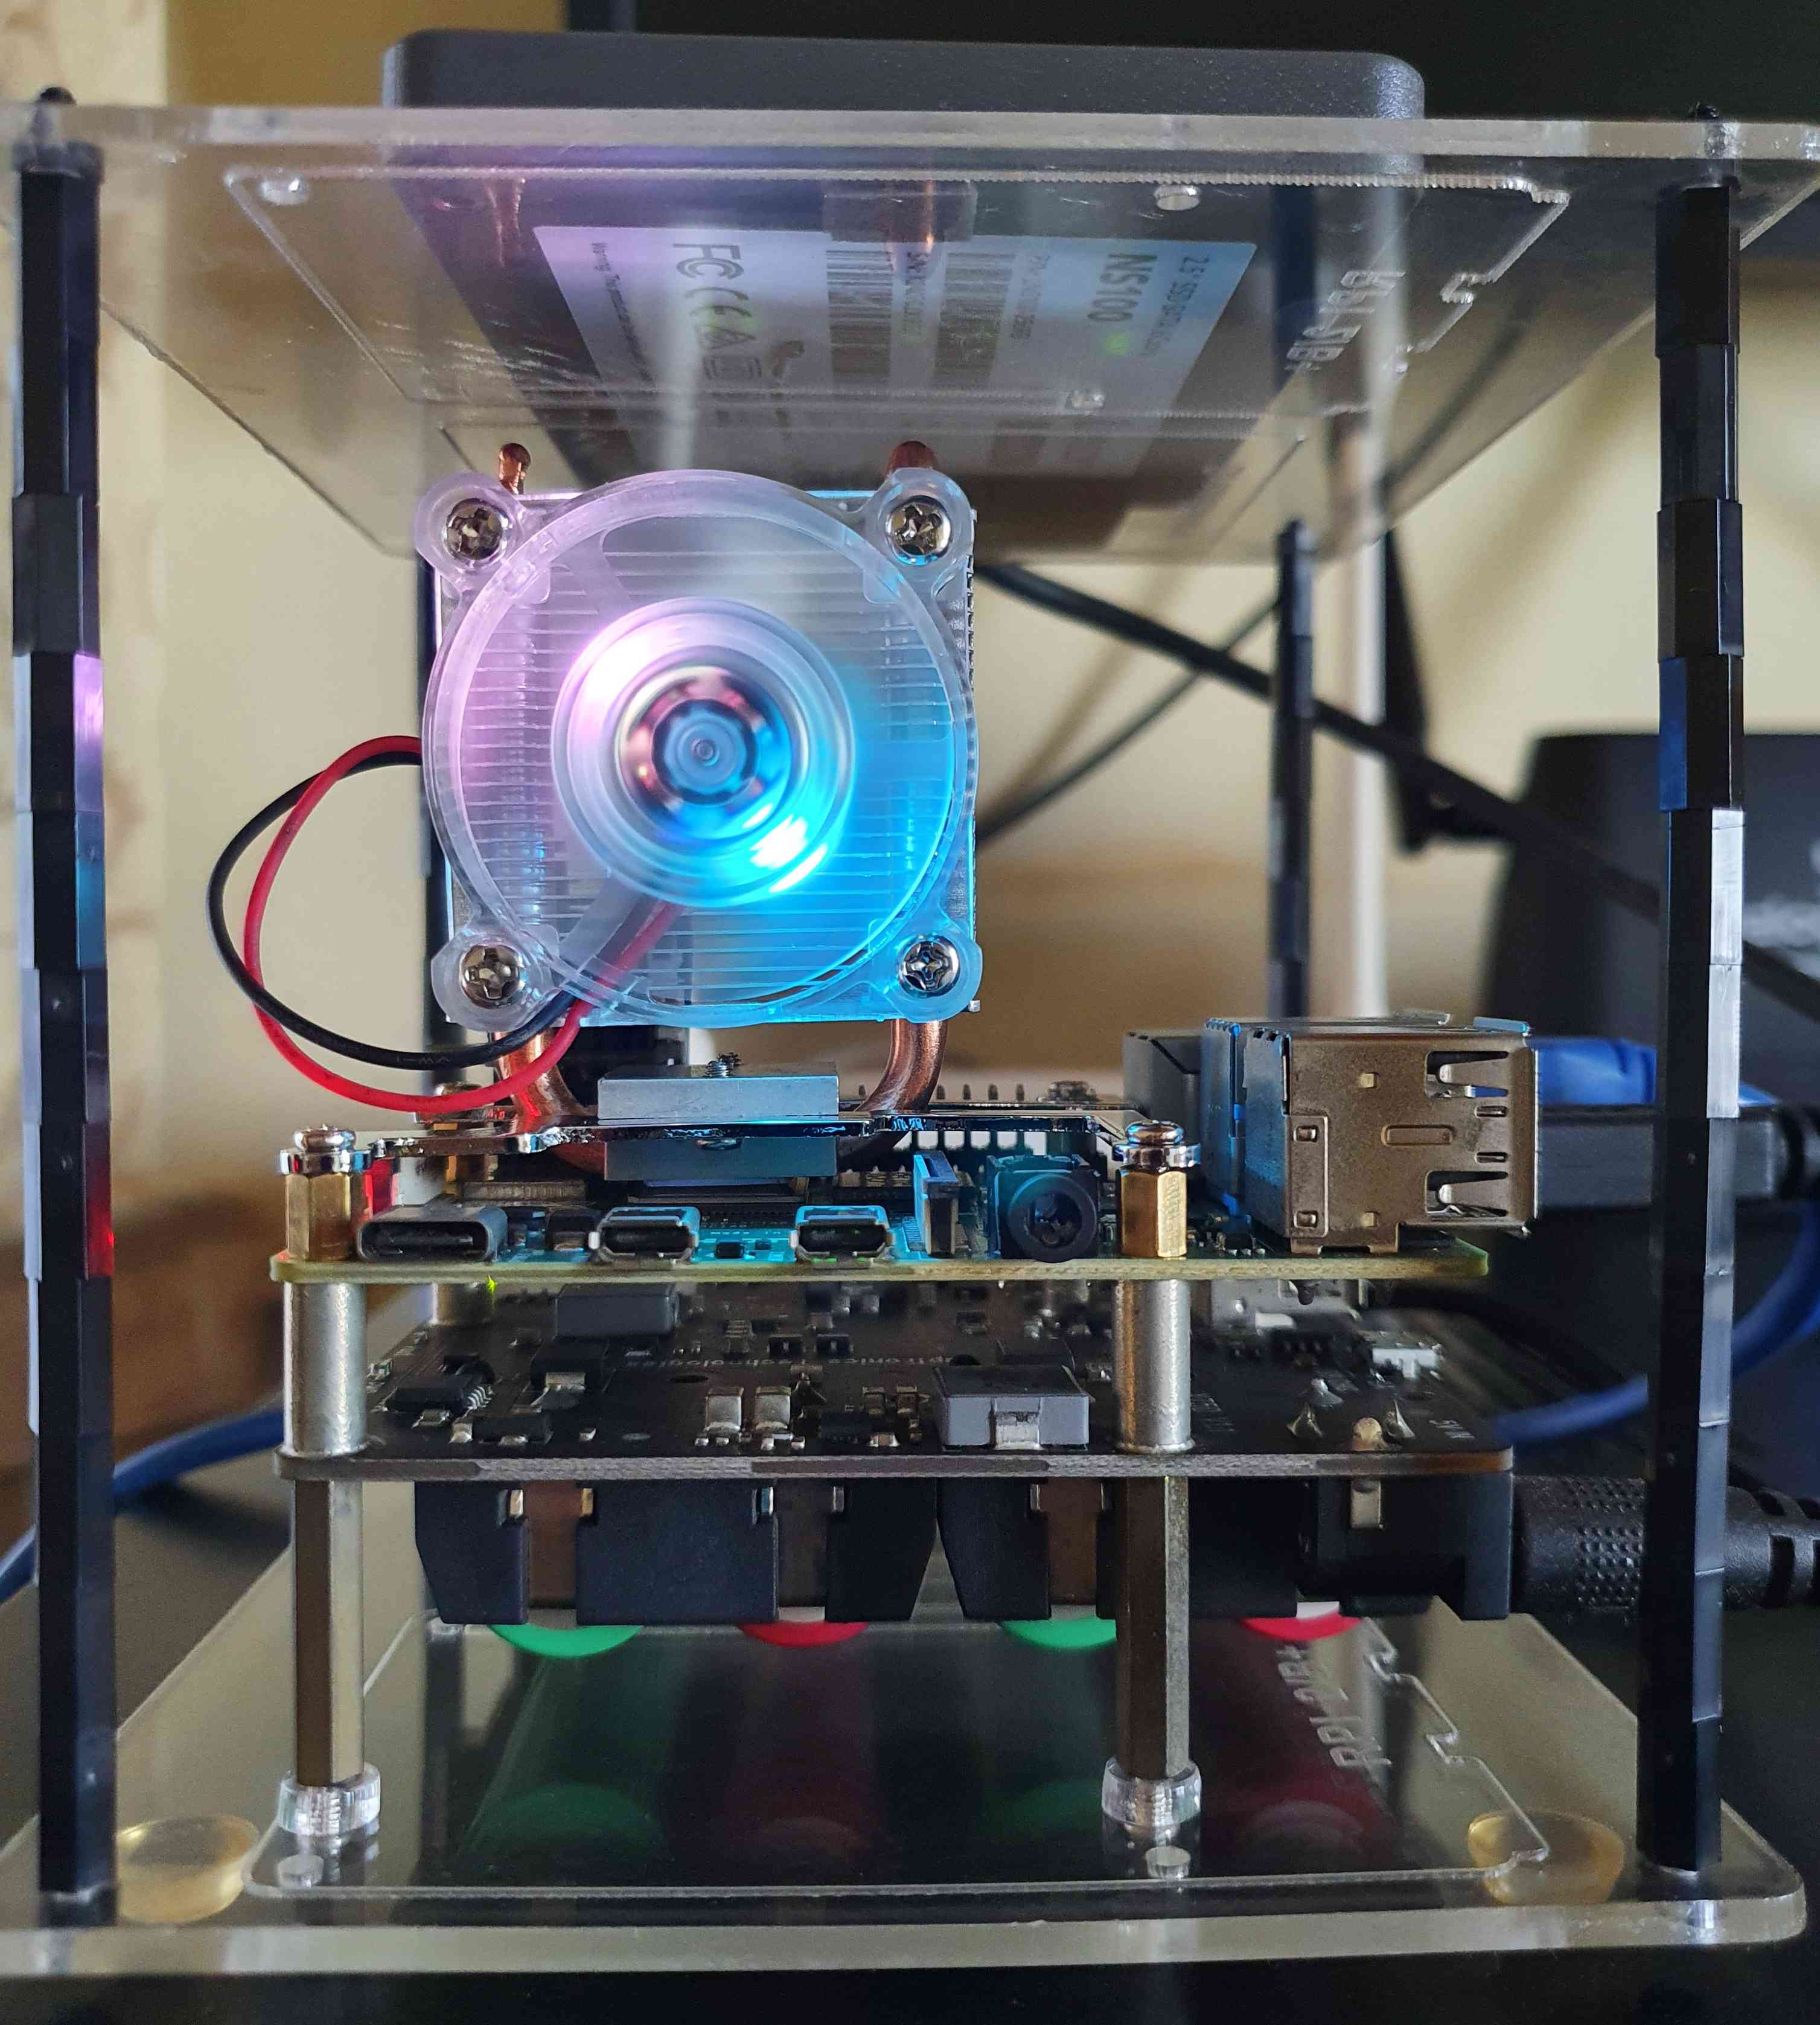
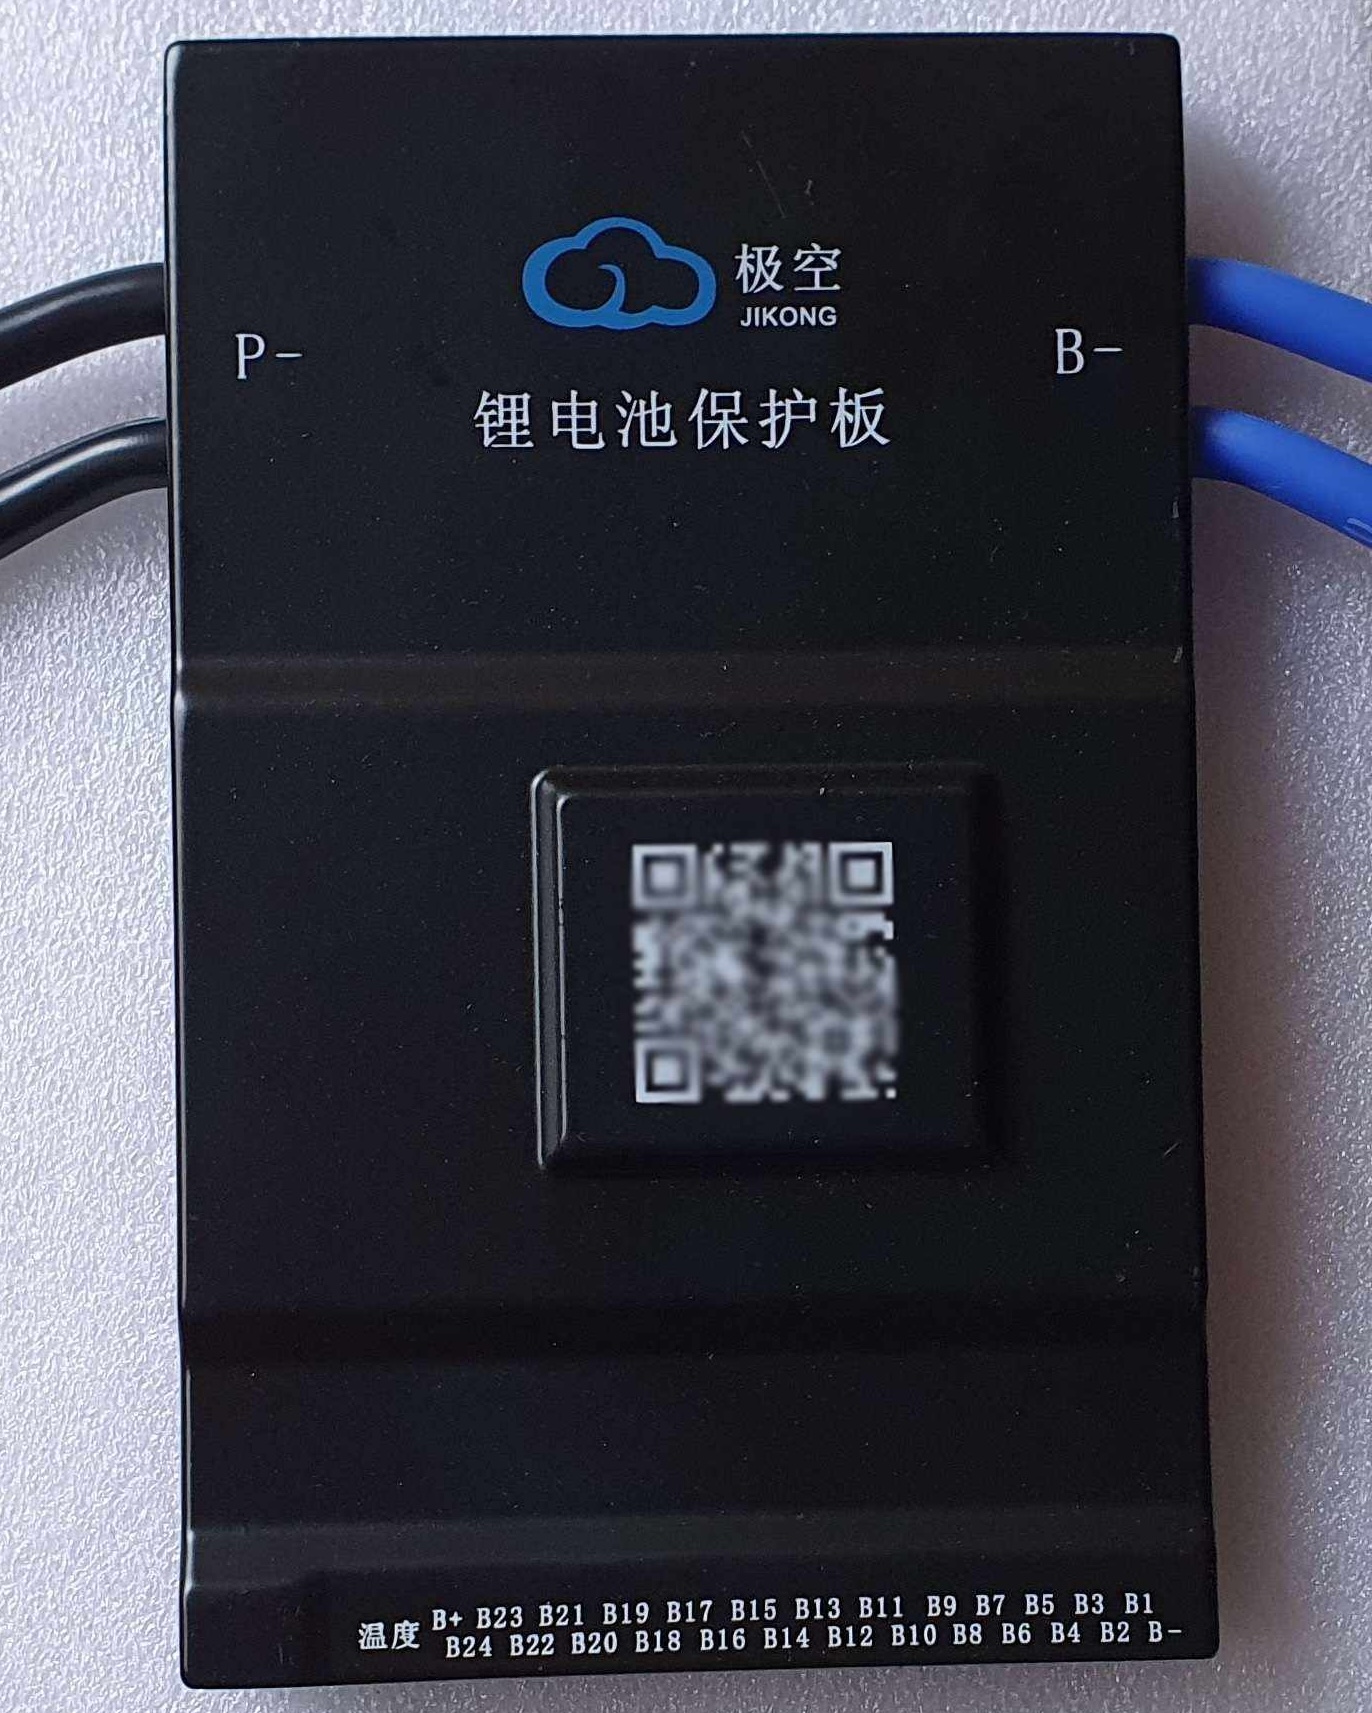
JIKONG, a leading player in the energy management sector, has developed a state-of-the-art Smart BMS that combines advanced features with user-friendly interfaces. The JIKONG Smart BMS (JKBMS) is an innovative solution designed to enhance the performance, efficiency, and safety of lithium-ion battery packs. The JKBMS serves as the brain of any battery system, overseeing its health, balancing individual cells, and managing charging and discharging processes.
Pros & Cons of Bluetooth capability of JKBMS
While WiFi connectivity is prevalent in many smart devices, Bluetooth serves as a versatile, energy-efficient alternative and it is straightforward to pair with Bluetooth-enabled mobile devices while minimizing the time and effort required for initial configuration. This simplicity makes the system accessible to a wide range of users. Additionally, this provides real-time monitoring capabilities of the battery system’s status such as voltage, current, and temperature directly from their handheld devices.
While accessing JKBMS over Bluetooth offers certain advantages in terms of simplicity and convenience if you have the JKBMS nearby. So what if you need to monitor your battery system from somewhere else over the internet? One of the primary drawbacks of accessing JKBMS over Bluetooth is the inherent limitation in range and connectivity. Bluetooth operates within a relatively short-range radius, typically around 10 meters in optimal conditions.
In this article, I will illustrate a smart and secure method for accessing your JKBMS from anywhere to overcome this challenge.
Beforehand, all you require is a Raspberry Pi equipped with Bluetooth capability and the JKBMS integrated into your battery system.
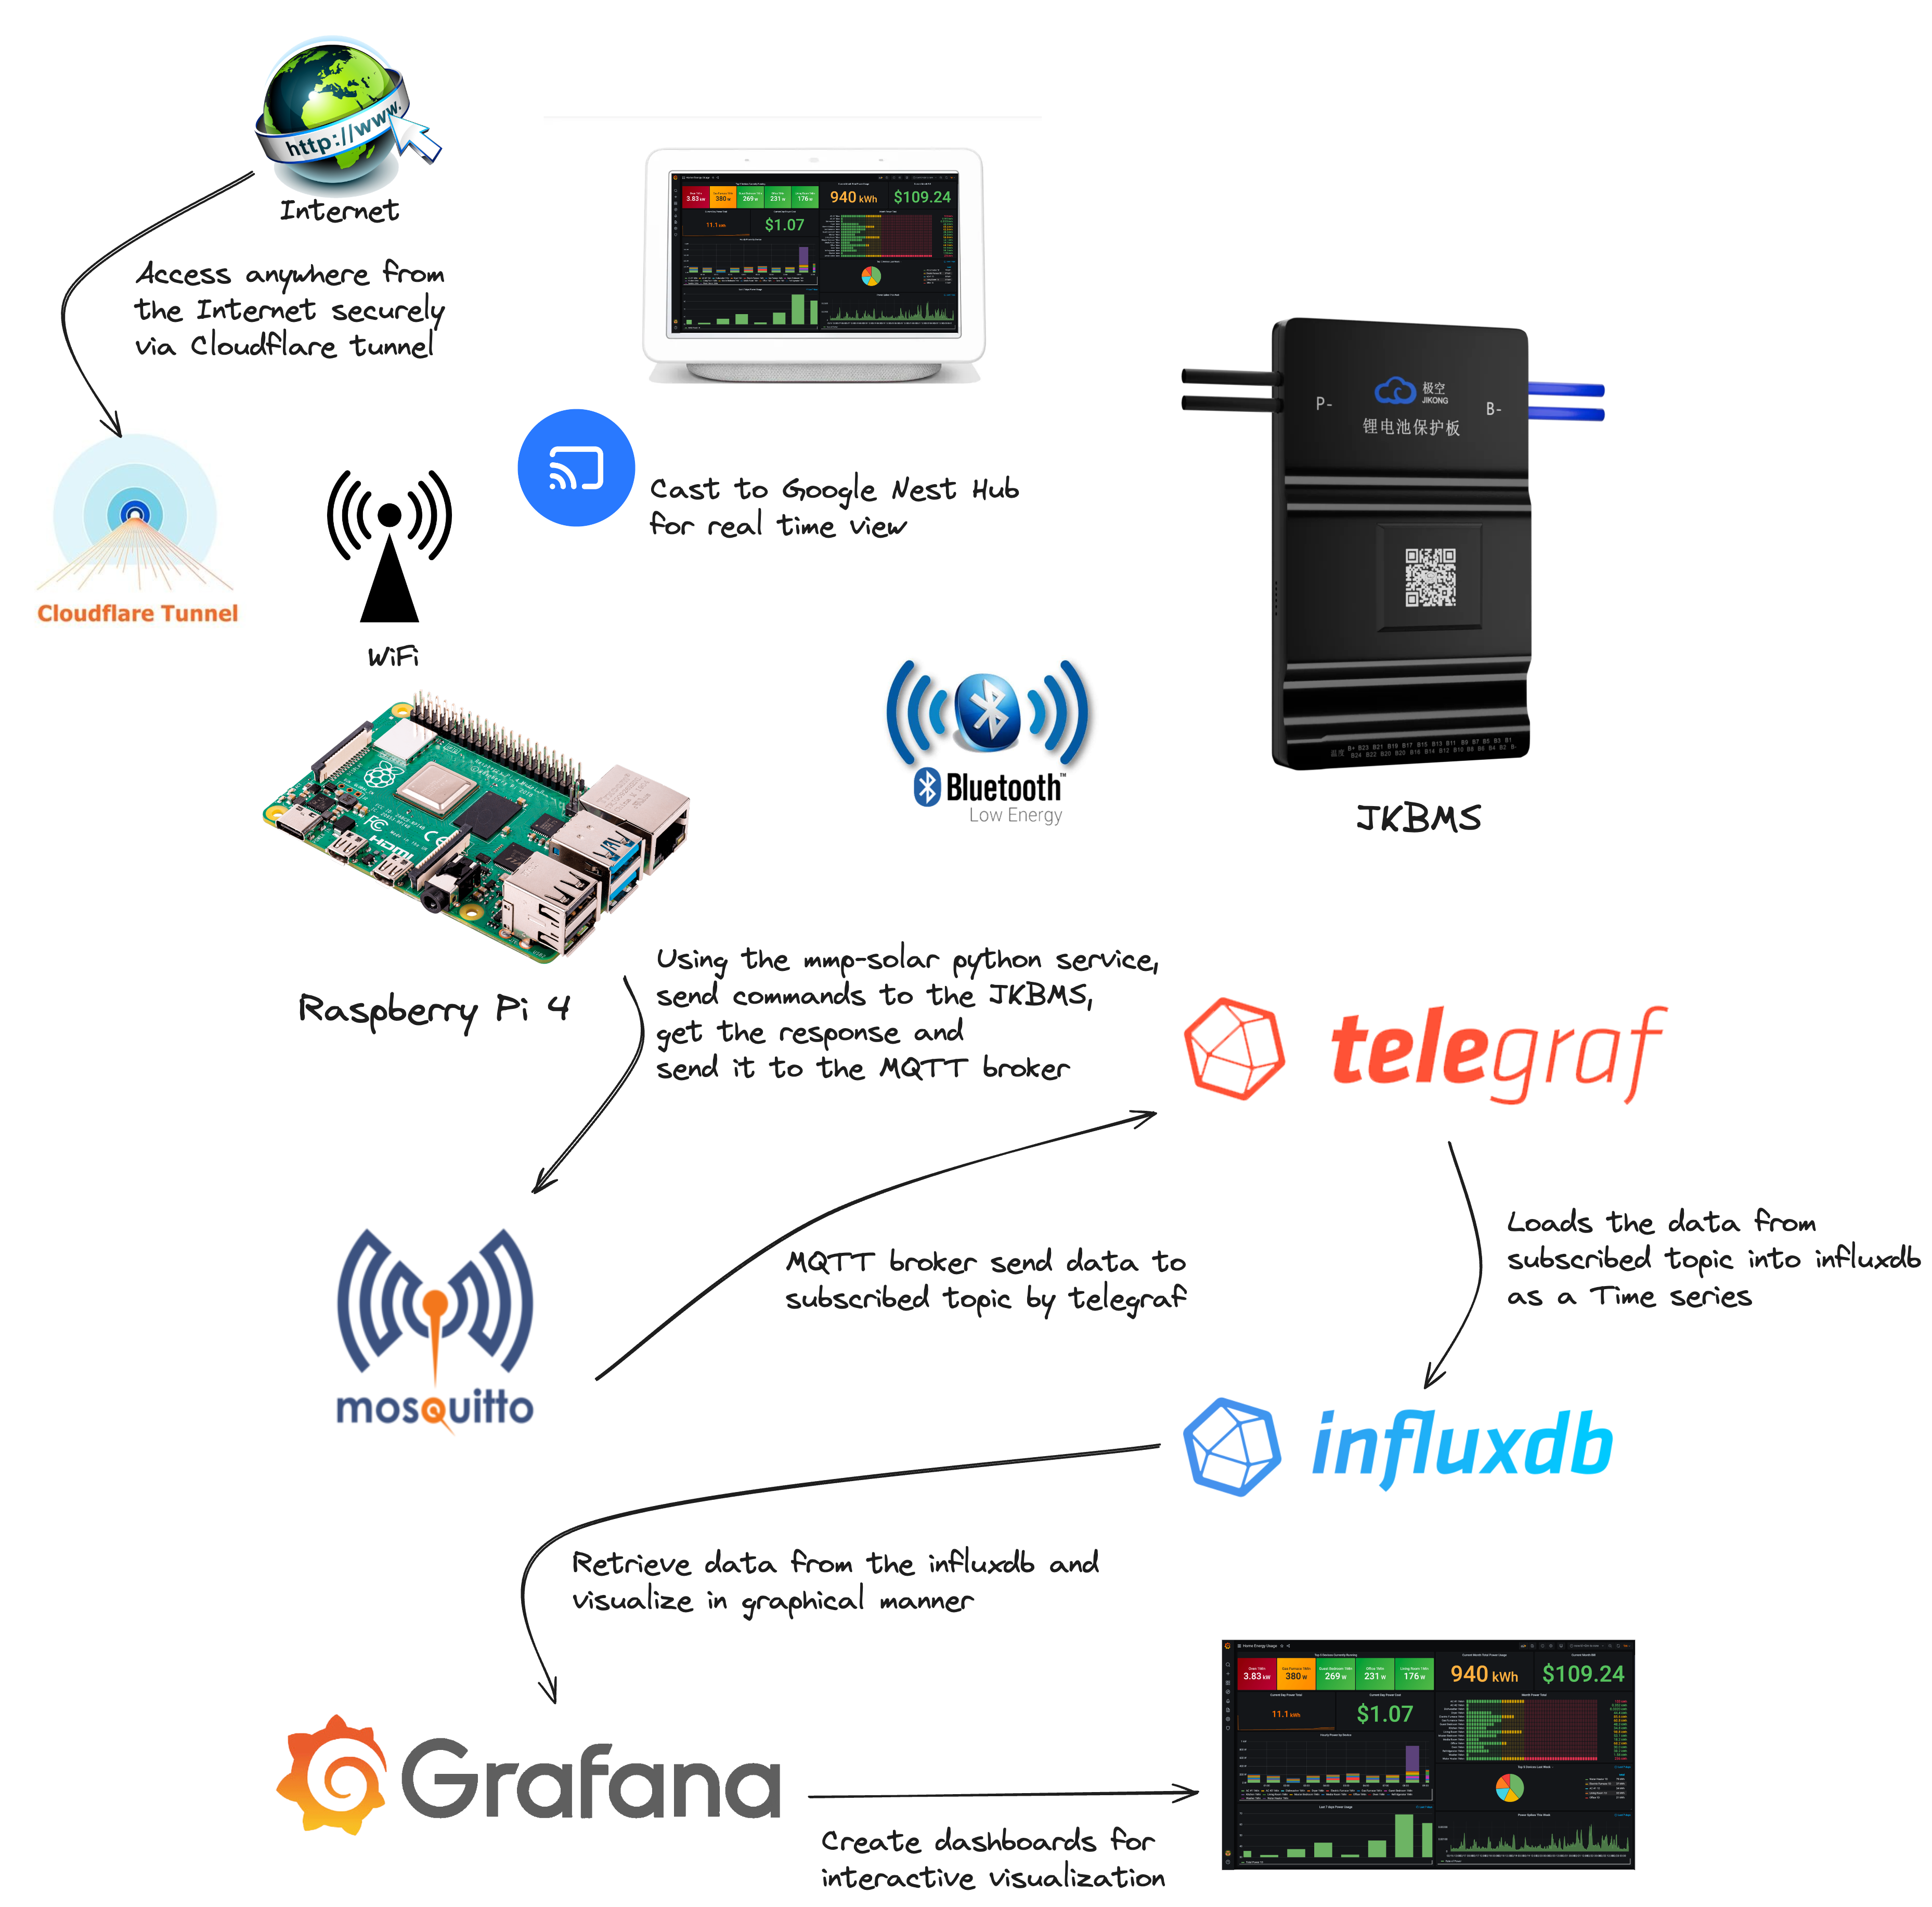
JKBMS Monitoring Setup Architecture
Setup Python Virtual Environment with mpp-solar
The mpp-solar python package is a set of commands that is designed to get information from solar inverters and other power devices mentioned on its wiki. Additionally, it enables users to interact with these devices programmatically, offering a range of functionalities for monitoring, controlling, and managing the connected equipment.
Let’s start it:
Upgrade the Raspberry PI repos and install the required dependencies.
apt update && apt upgrade
apt install libglib2.0-dev
Prepare virtual environment with mpp-solar package for JKBMS.
python3 -m venv jkbms-monitoring

source jkbms-monitoring/bin/activate

pip3 install mppsolar[ble]
![Install mppsolar[ble] python package](https://content.sysopstechnix.com/postimages/MonitorJKBMSRemotelyFromAnywhere/Install-mmp-solar-ble.png)
Obtain the Bluetooth device address
Create a new file named bt_scanner.py, paste the command snippet provided below, and execute it using Python 3. This will allow you to obtain the device address for your JKBMS Bluetooth device.
import asyncio
from bleak import BleakScanner

async def main():
    devices = await BleakScanner.discover()
    for d in devices:
        print(d)

asyncio.run(main())
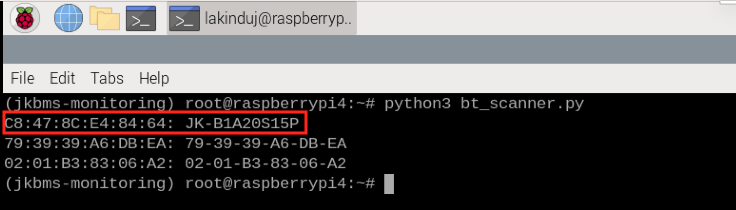
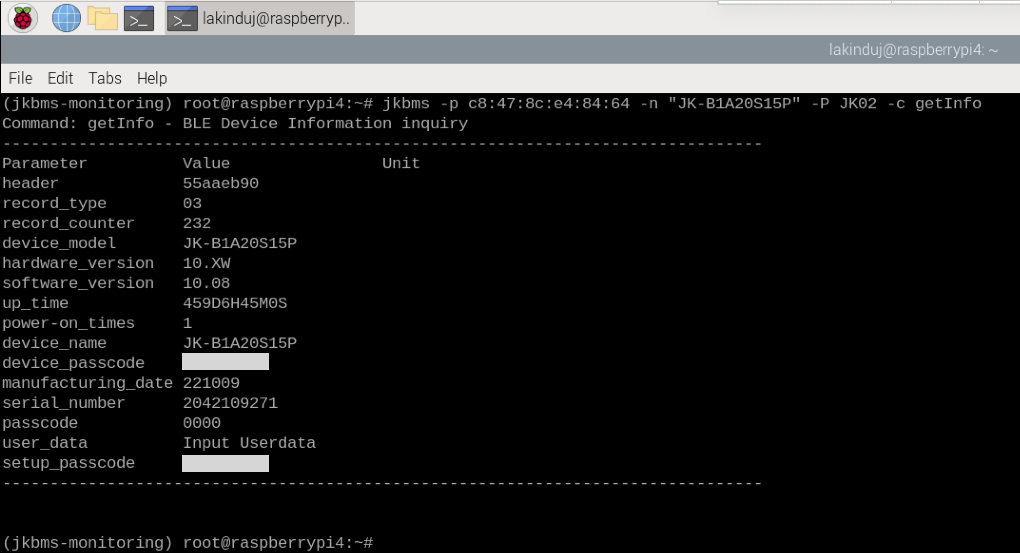
Attempt to retrieve data from the JKBMS device utilizing the mpp-solar Python package by specifying your Bluetooth address. For more details you can refer to the “jkbms” command usage page: https://github.com/jblance/mpp-solar/wiki/Detailed-Usage#jkbms-usage
jkbms -p c8:47:8c:e4:84:64 -n "JK-B1A20S15P" -P JK02 -c getInfo
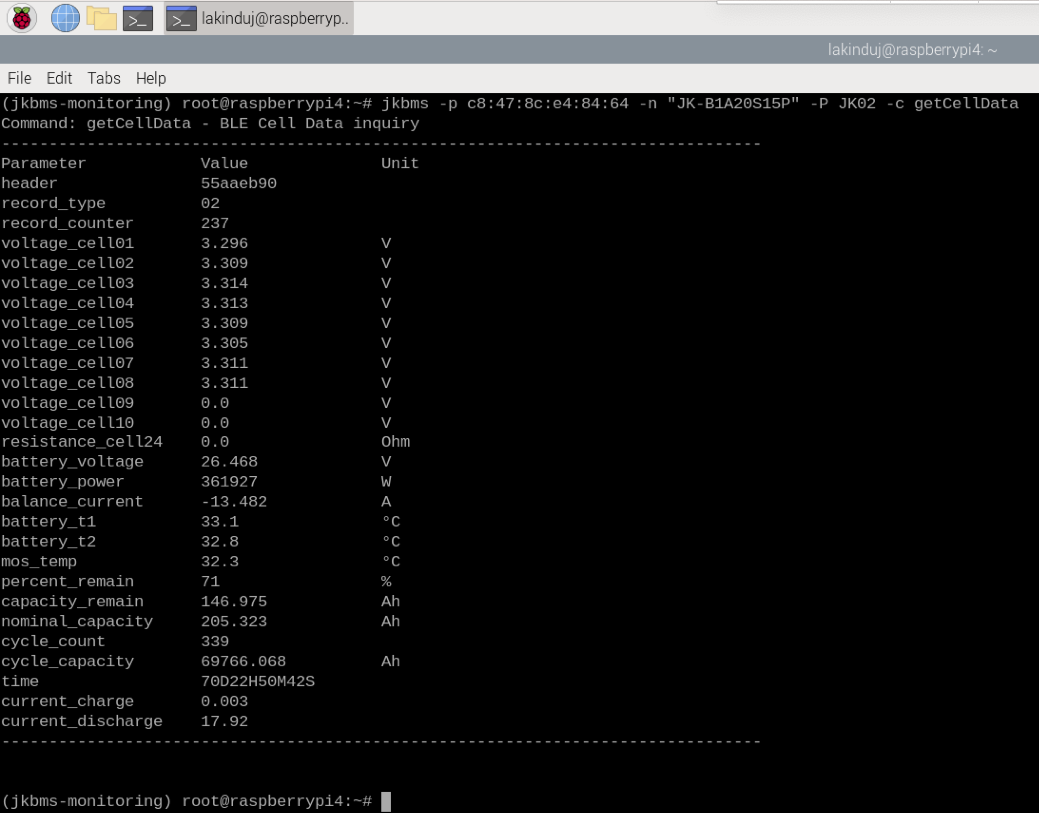
jkbms -p c8:47:8c:e4:84:64 -n "JK-B1A20S15P" -P JK02 -c getCellData
Setting up a MQTT Broker on the Raspberry Pi
Setting up an MQTT broker on a Raspberry Pi is a great way to facilitate communication between devices in an IoT environment. Here’s a step-by-step guide to setting up the Mosquitto MQTT broker on a Raspberry Pi:
Install Mosquitto and Set the MQTT service to start on boot
Note: You might also want to install the Mosquitto clients if you plan to interact with the MQTT broker from the command line or from other devices.
apt install -y mosquitto mosquitto-clients

systemctl enable mosquitto.service && systemctl start mosquitto.service
Test the MQTT Broker
You can test the MQTT broker by subscribing to a test topic and publishing a message to it. Open two terminal windows, in one, subscribe to a topic, and in the other publish a message:
Terminal 1 (Subscribe):
mosquitto_sub -t test/topic
Terminal 2 (Publish):
mosquitto_pub -t test/topic -m "Hello, MQTT!"
You should see the message “Hello, MQTT!” displayed in the terminal where you subscribed to the topic. You now have an MQTT broker running on your Raspberry Pi.
Install and Configure Influx DB
InfluxDB is an open-source time-series database developed by InfluxData. It is designed to handle high write and query loads for time-stamped data. You can install InfluxDB using the following commands.
Add the influx repos
wget -qO- https://repos.influxdata.com/influxdb.key | sudo apt-key add -

echo "deb https://repos.influxdata.com/debian $(lsb_release -cs) stable" | sudo tee /etc/apt/sources.list.d/influxdb.list

apt-key adv --keyserver keyserver.ubuntu.com --recv-keys D8FF8E1F7DF8B07E

apt update
Install Influx DB and Set it to start on boot
apt install influxdb
systemctl enable influxdb.service && systemctl start influxdb
Create Databases and Users
You can use the InfluxDB command-line interface to create databases and users.
influx

> create database jkbms
> use jkbms

> create user grafana with password '########' with all privileges
> grant all privileges on jkbms to grafana

> exit
That’s it! You’ve now installed and configured InfluxDB. You can start ingesting data into your InfluxDB instance, by using Telegraf or other data collection tools that integrate with InfluxDB.
Install and Configure Telegraf
Telegraf is a plugin-driven server agent for collecting and reporting metrics and is often used in conjunction with other tools like InfluxDB for storing metrics data. You can install Telegraf using the following command:
sudo apt-get install telegraf
Once installed, you need to configure Telegraf. The default configuration file is usually located at /etc/telegraf/telegraf.conf and you need to comment out the line with “[[outputs.influxdb]]” by using # at the start.
Then create two new configuration files under /etc/telegraf/telegraf.d directory as follows.
vim /etc/telegraf/telegraf.d/mqtt-input.conf
[[inputs.mqtt_consumer]]
  servers = ["tcp://127.0.0.1:1883"]
  topics = [
    "#",
  ]
  data_format = "influx"
vim /etc/telegraf/telegraf.d/influx-output.conf
[[outputs.influxdb]]
  urls = ["http://127.0.0.1:8086"]
  database = "jkbms"
  skip_database_creation = true
  username = "grafana"
  password = "########"
After configuring Telegraf, save the changes to the configuration file and then start Telegraf.
systemctl enable telegraf && systemctl start telegraf
Install and Configure Grafana
Grafana is an open-source platform for monitoring and observability that allows you to query, visualize, alert on, and understand your metrics data no matter where it lives. You can install Grafana using the following commands.
Add grafana repos
wget -q -O - https://packages.grafana.com/gpg.key | sudo apt-key add -

echo "deb https://packages.grafana.com/oss/deb stable main" | sudo tee /etc/apt/sources.list.d/grafana.list

apt update
Install Grafana and Set it to start on boot
apt install grafana

systemctl enable grafana-server && systemctl start grafana-server
That’s it! You’ve now installed Grafana. You can start building dashboards and visualizing your data from various sources in this case we are connecting a data source as InfluxDB.
Add InfluxDB as a Data Source to Grafana
By default, Grafana listens on port 3000 for HTTP requests. You can access Grafana using a web browser by navigating to http://localhost:3000 (or replace localhost with the hostname or IP address of your server if necessary).
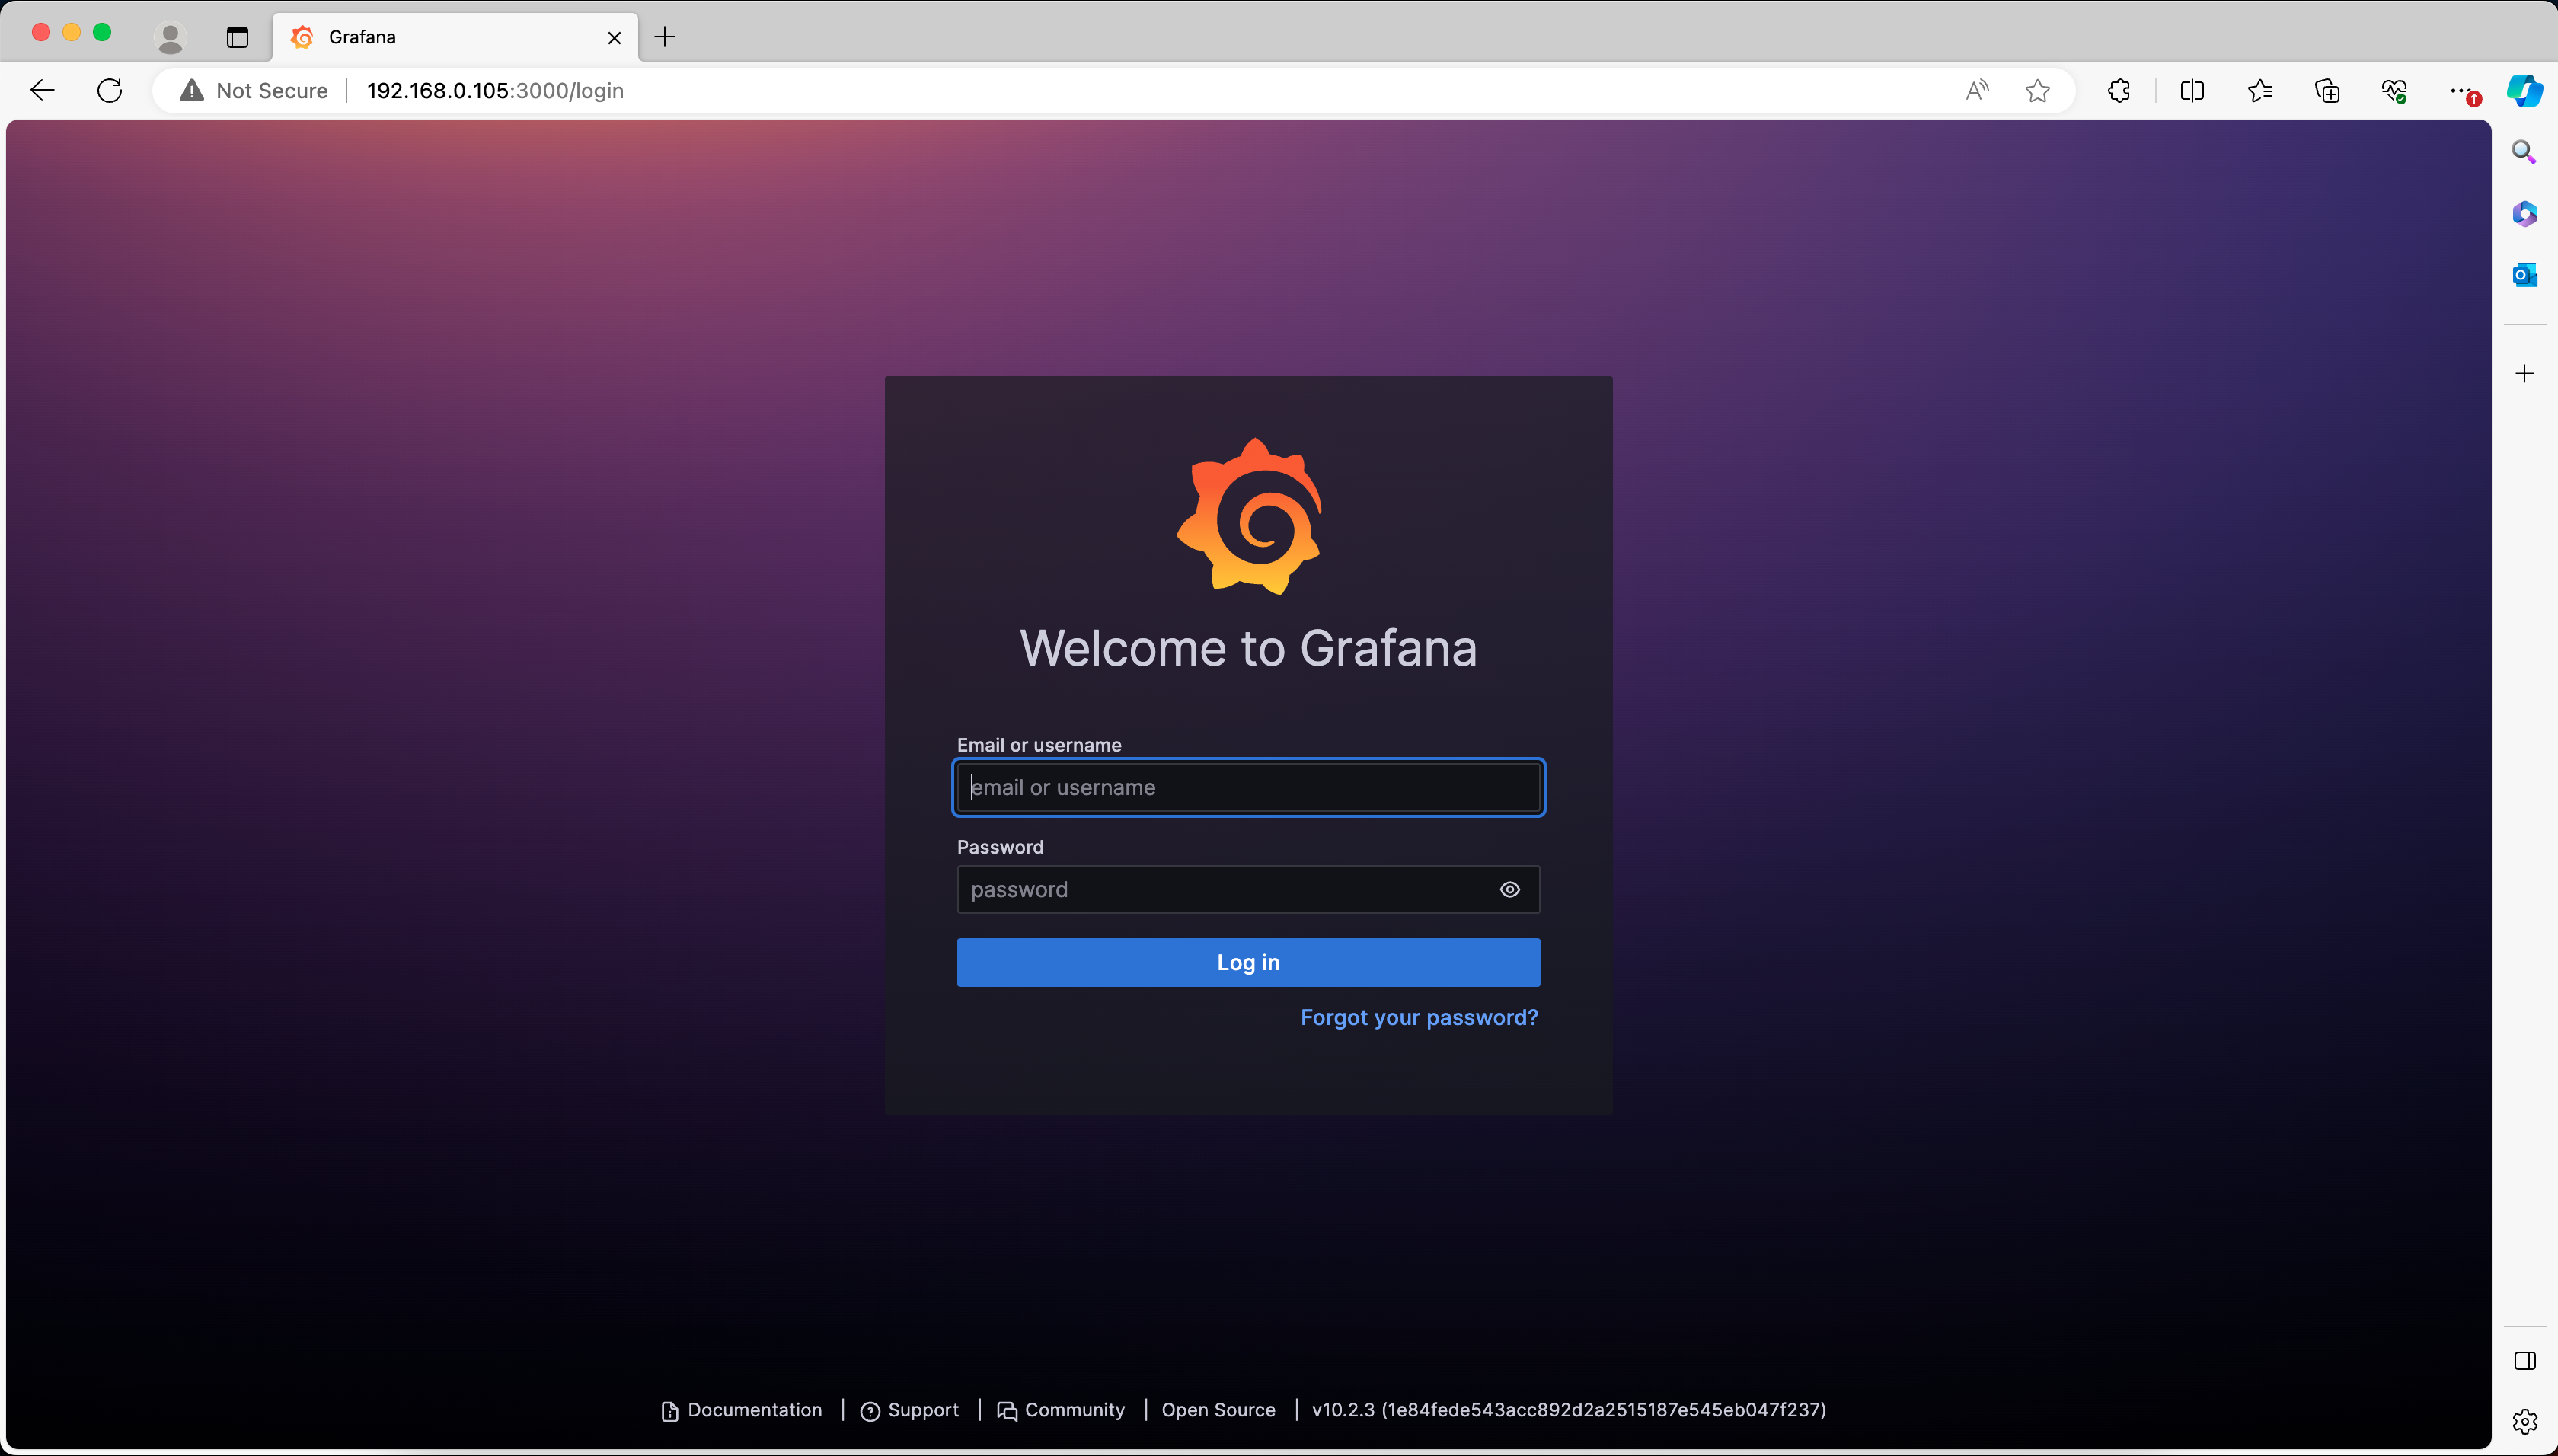
Note: The default username and password are both set to admin. You will be prompted to change the password on your first login.
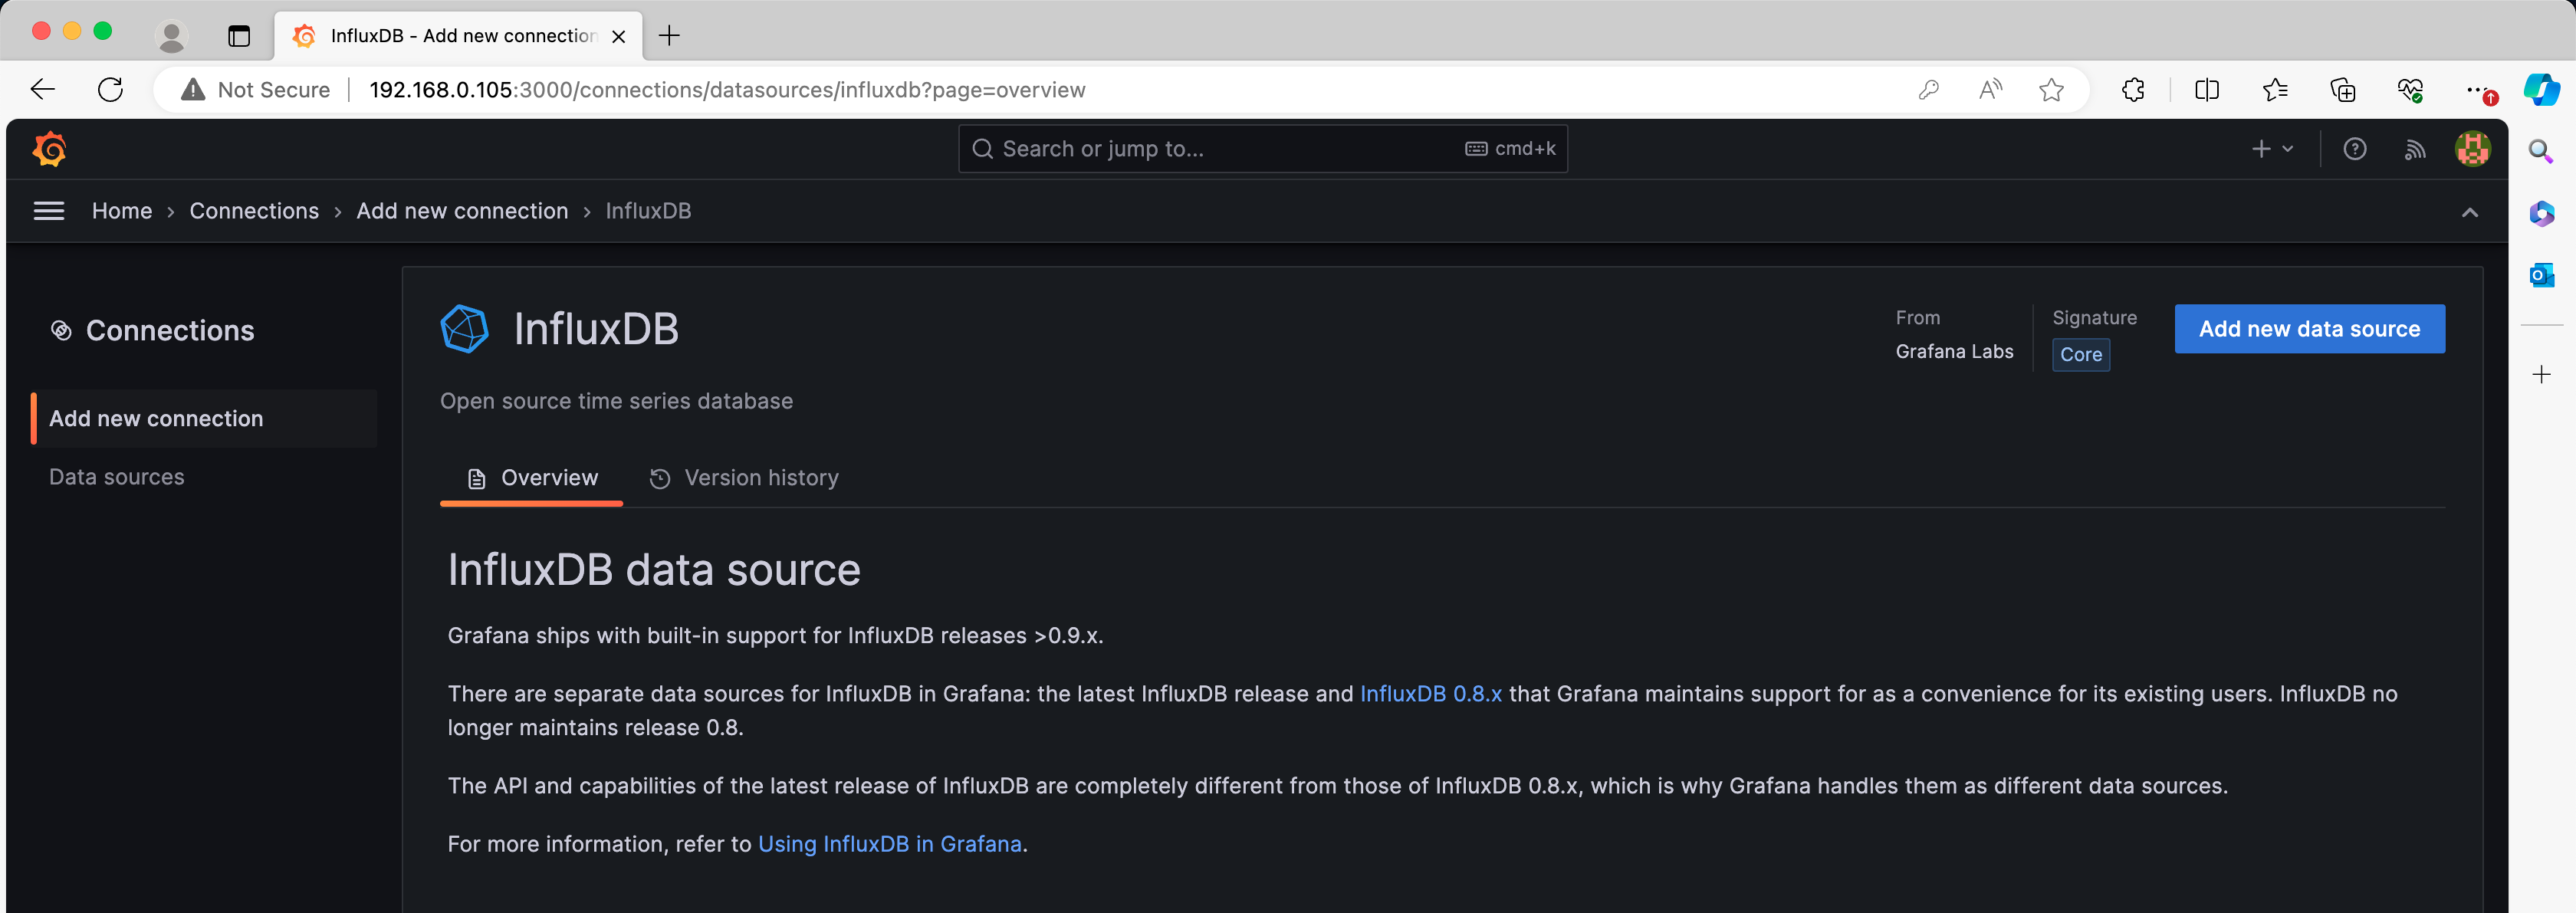
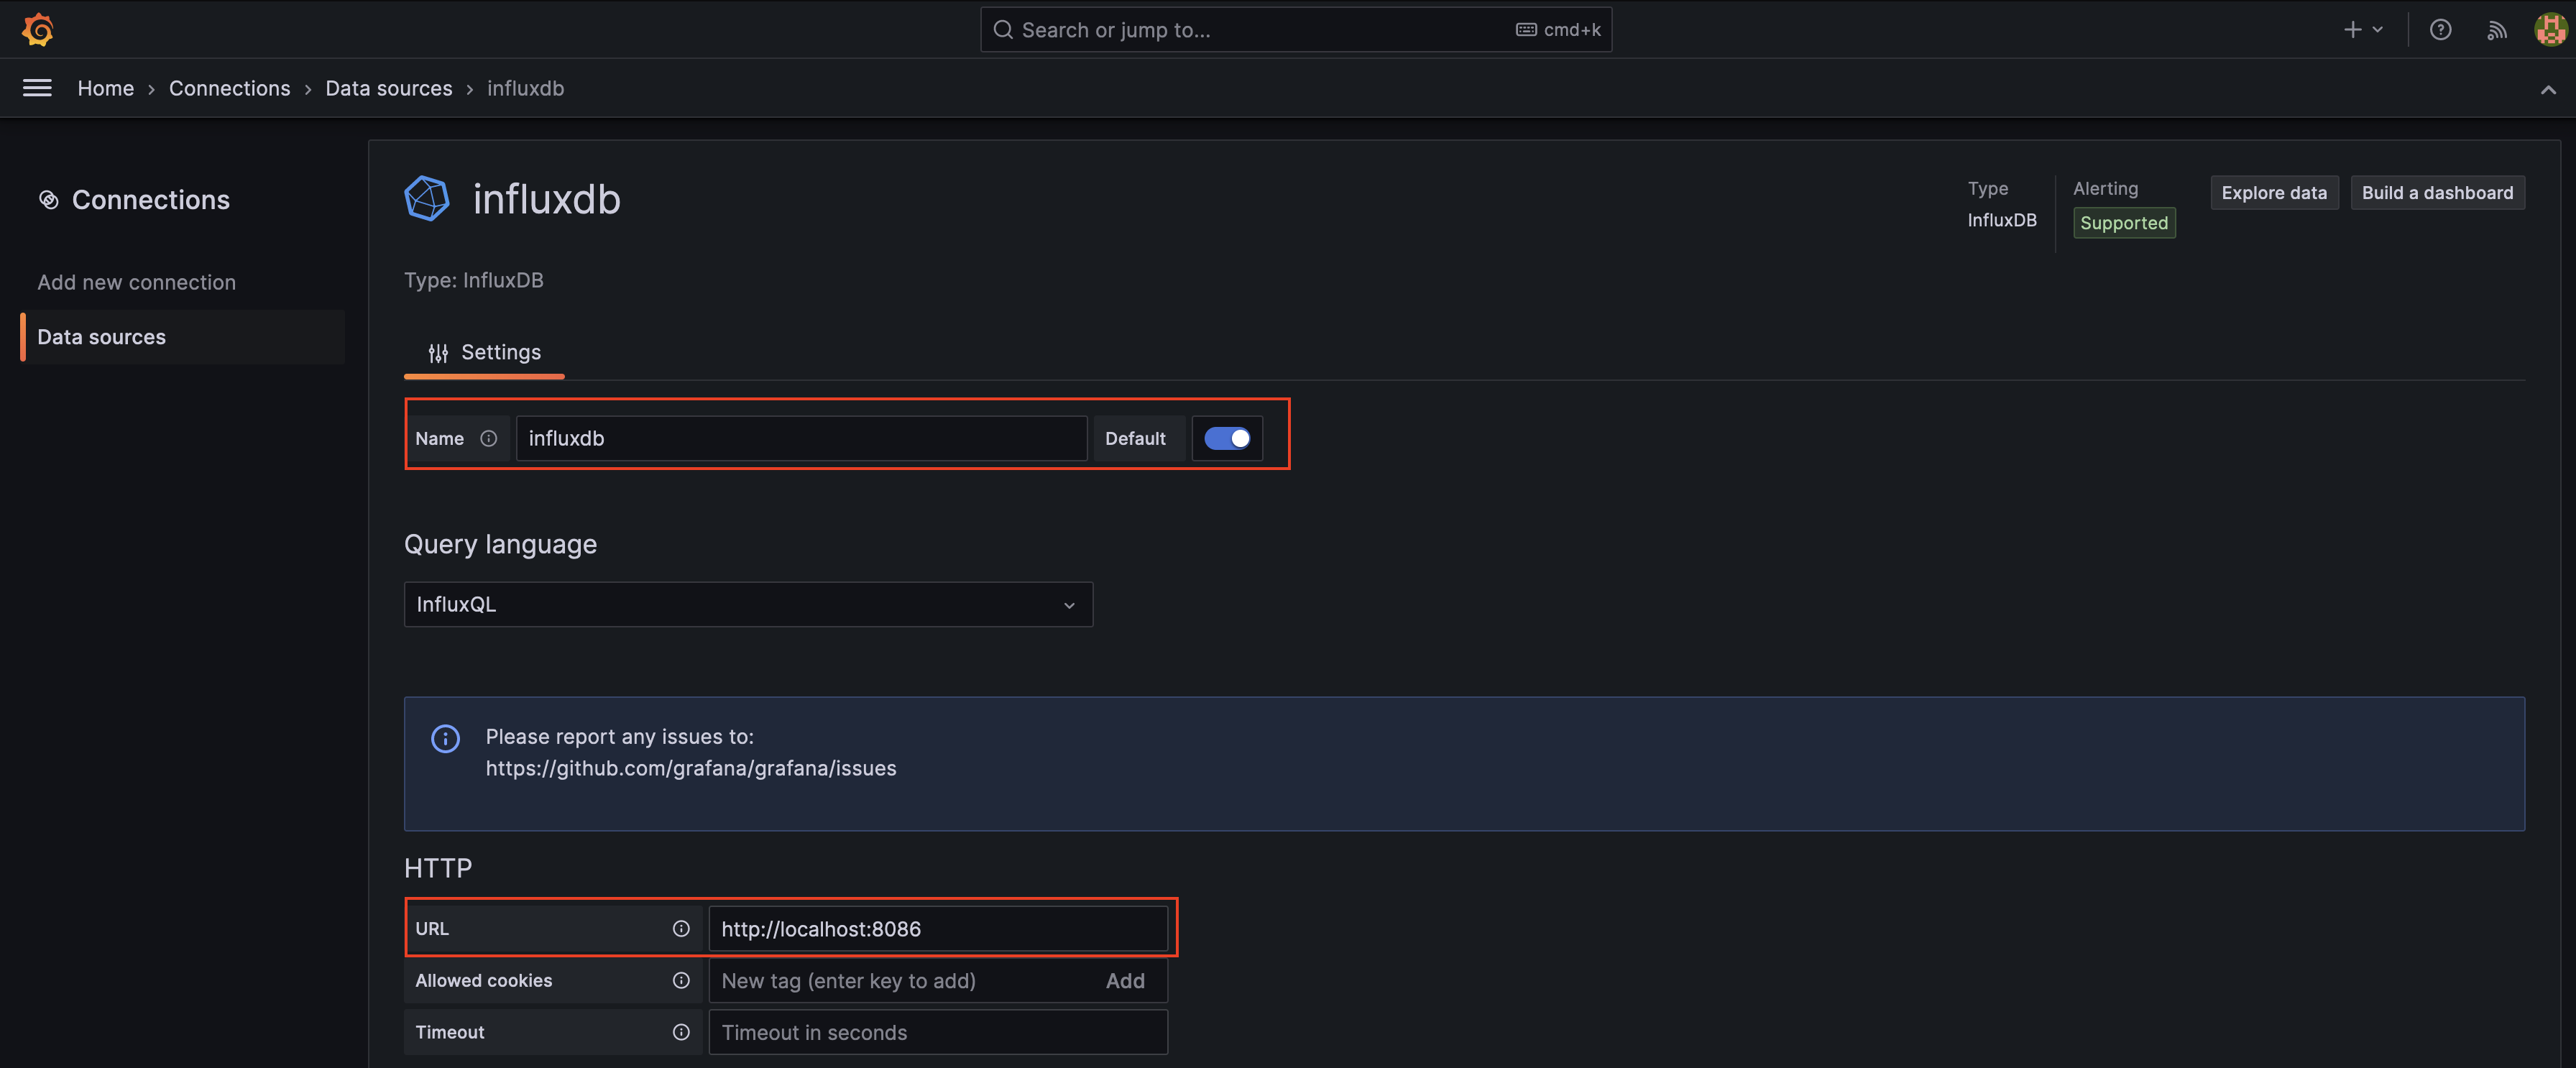
Navigate to the Configuration menu (on the left sidebar) and select “Connections” > “Data Sources.” Click on the “Add new data source” button. Choose “InfluxDB” from the list of available data sources.
In the InfluxDB settings, you need to provide the following information:
- Name: Choose a name for your data source.
- URL: Enter the URL of your InfluxDB instance, e.g.,
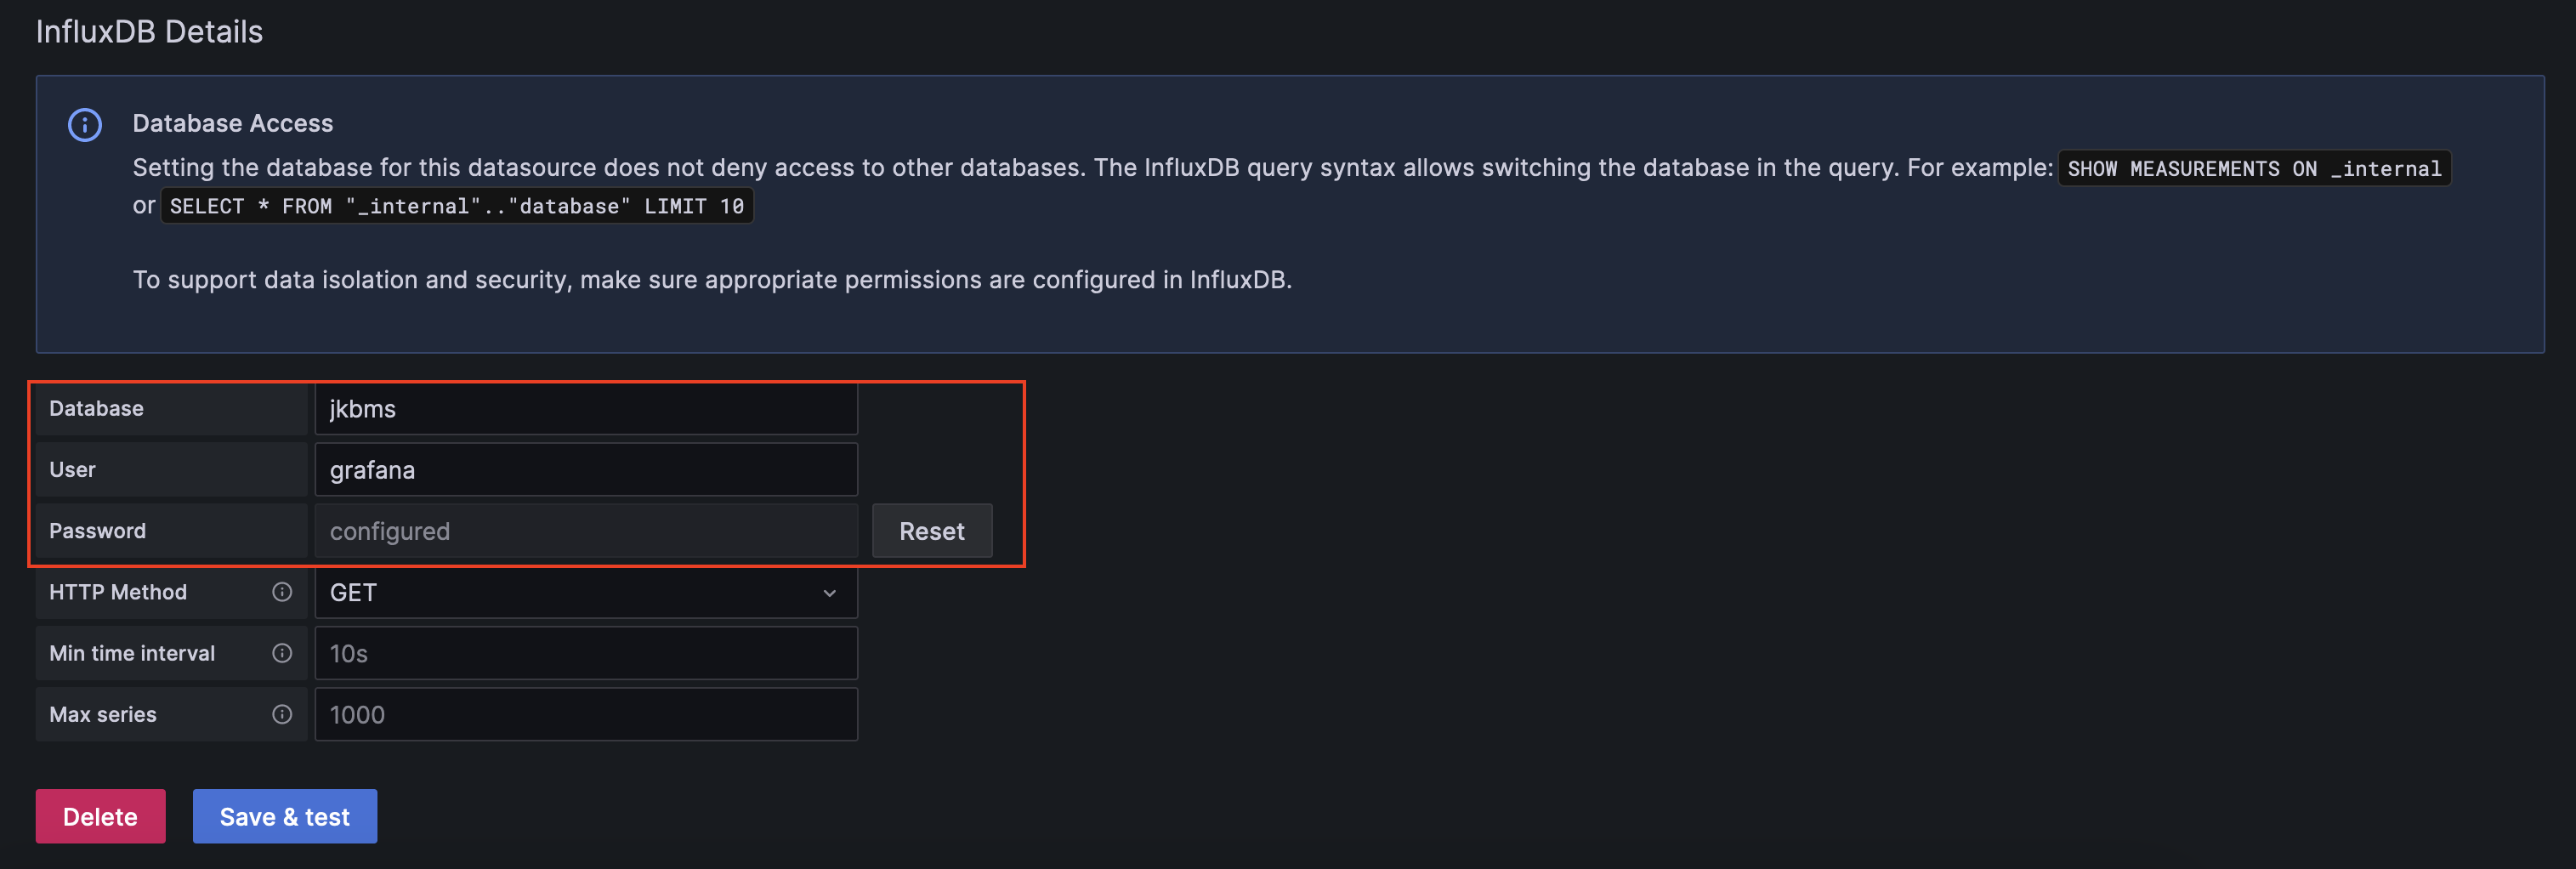
http://localhost:8086. - Database: Specify the name of the InfluxDB database you want to query.
- User: Enter the username if authentication is enabled.
- Password: Enter the password if authentication is enabled.
Now that the data source is configured, you can create a new dashboard. Go to the left navigation pane, click on “Dashboards”, and create a new Dashboard.
In the dashboard view, click on “Add Visualization” and choose the data source as you created in the previous step.
In the panel settings, under the “Query” tab, you can define your InfluxDB query to fetch the data you want to visualize. Write your InfluxQL query in the query editor or you can use the Query Builder to assist in building your query.
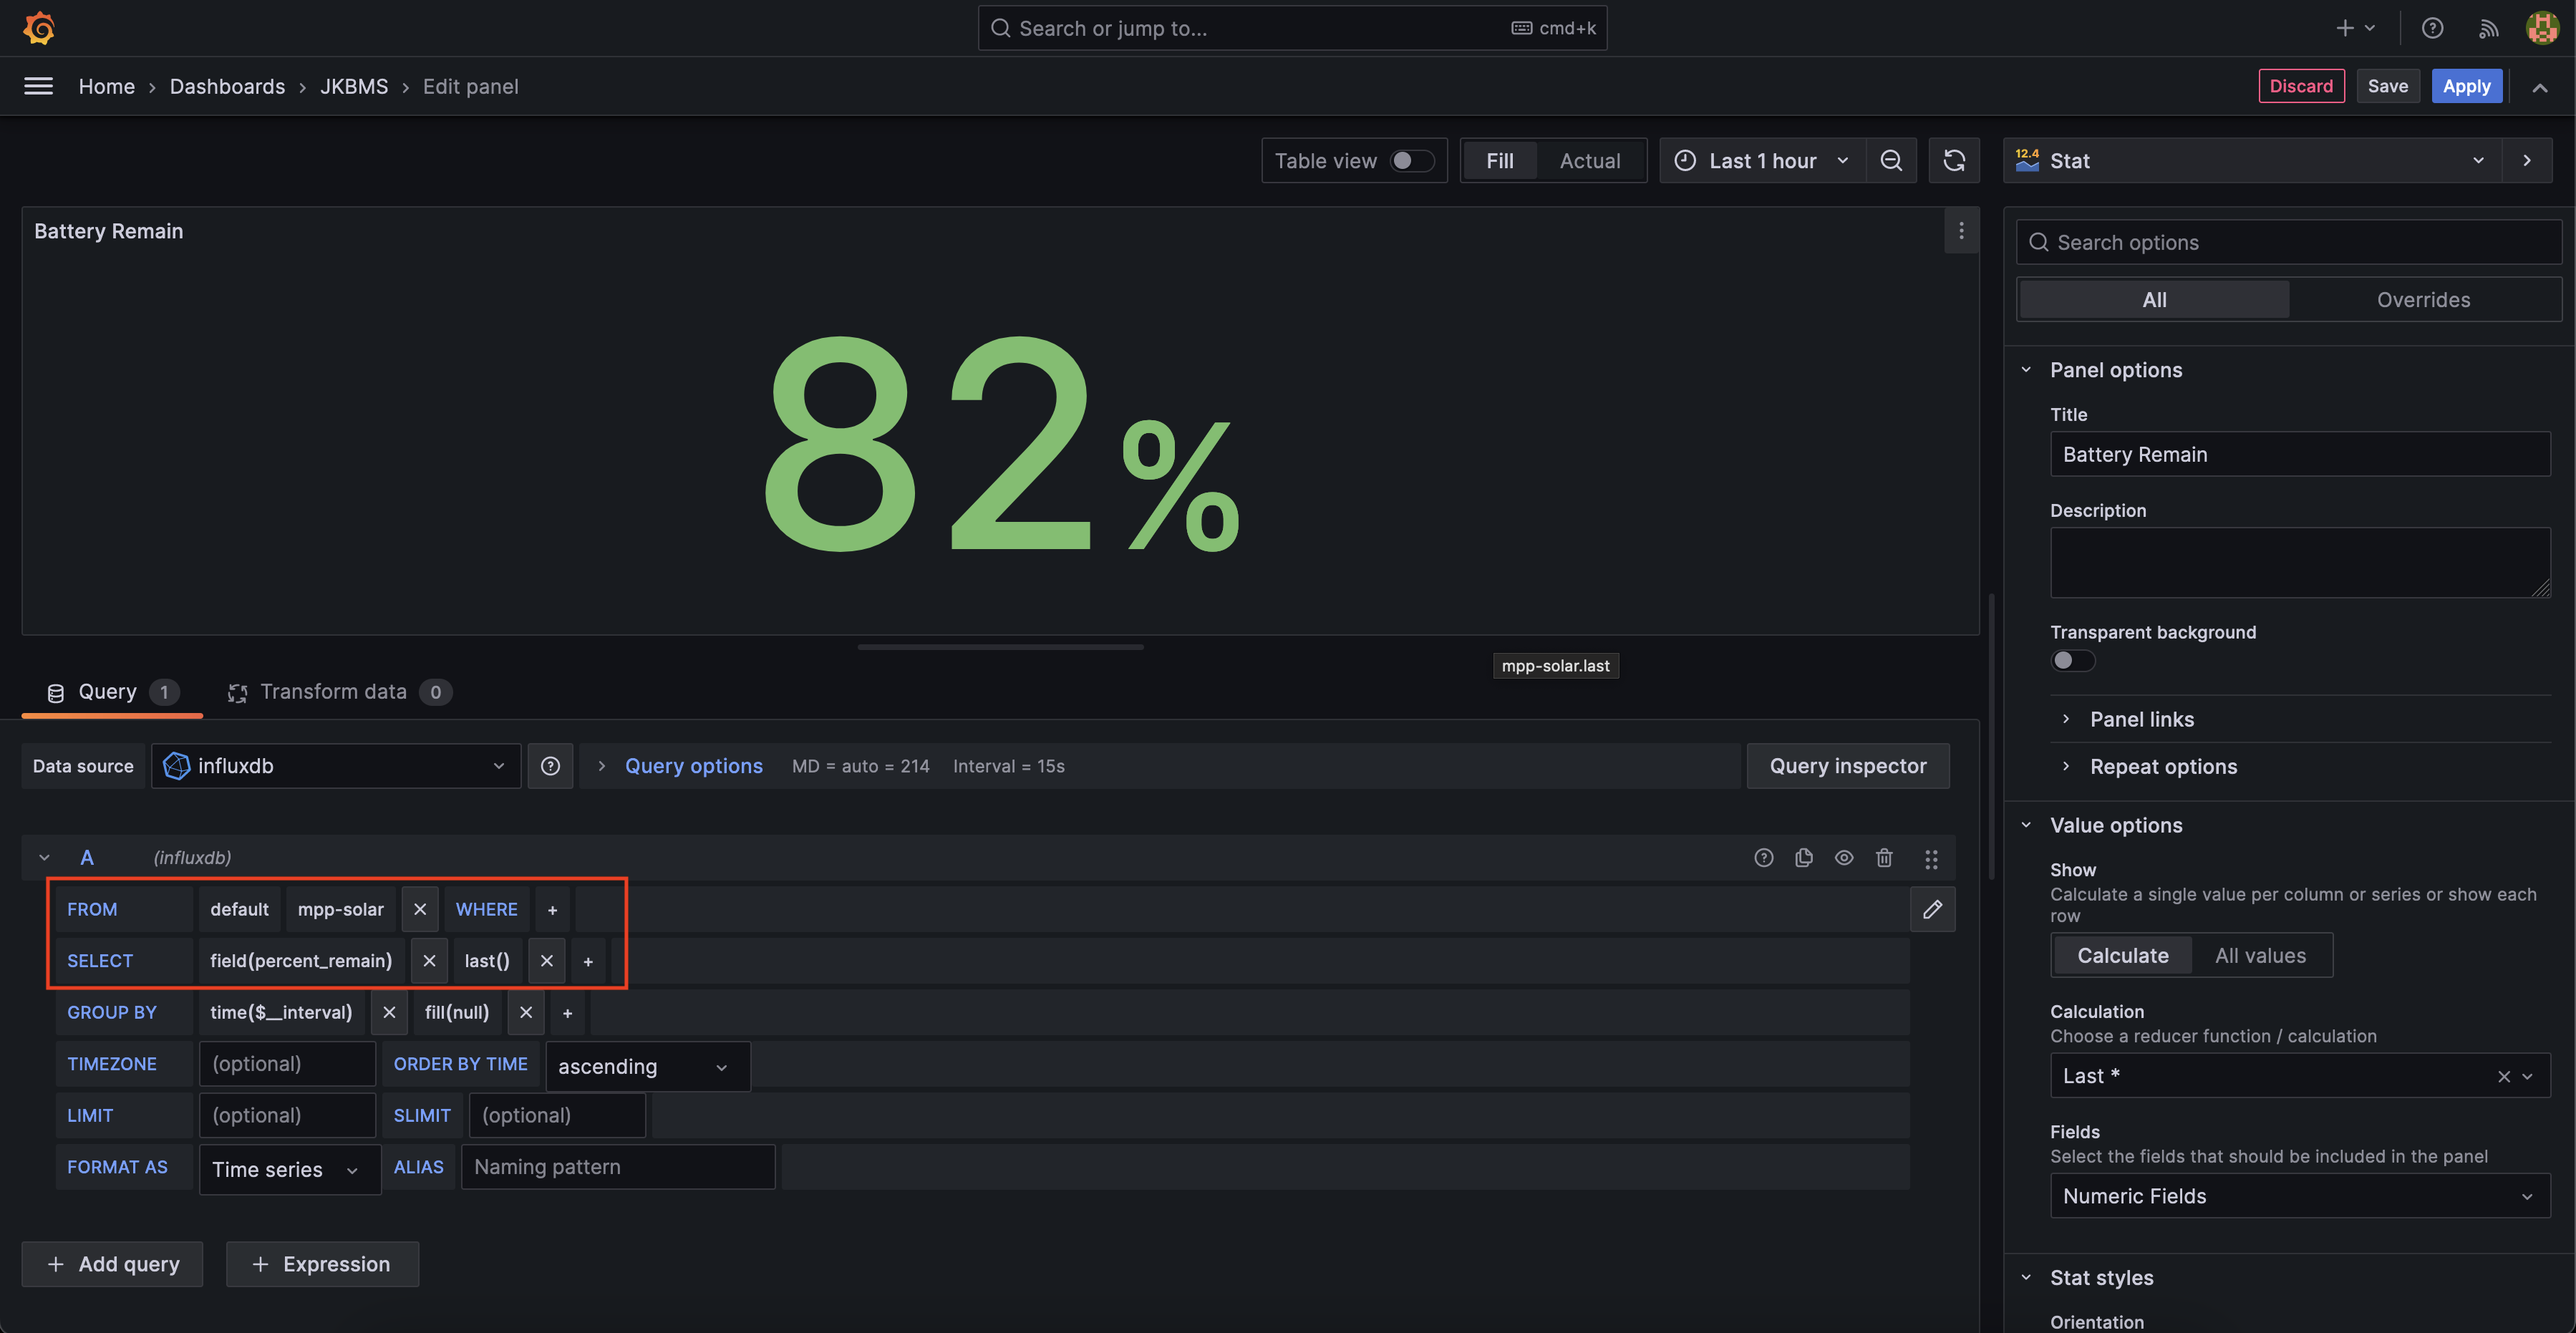
Customize the visualization settings such as axes, colors, and legends according to your preferences.
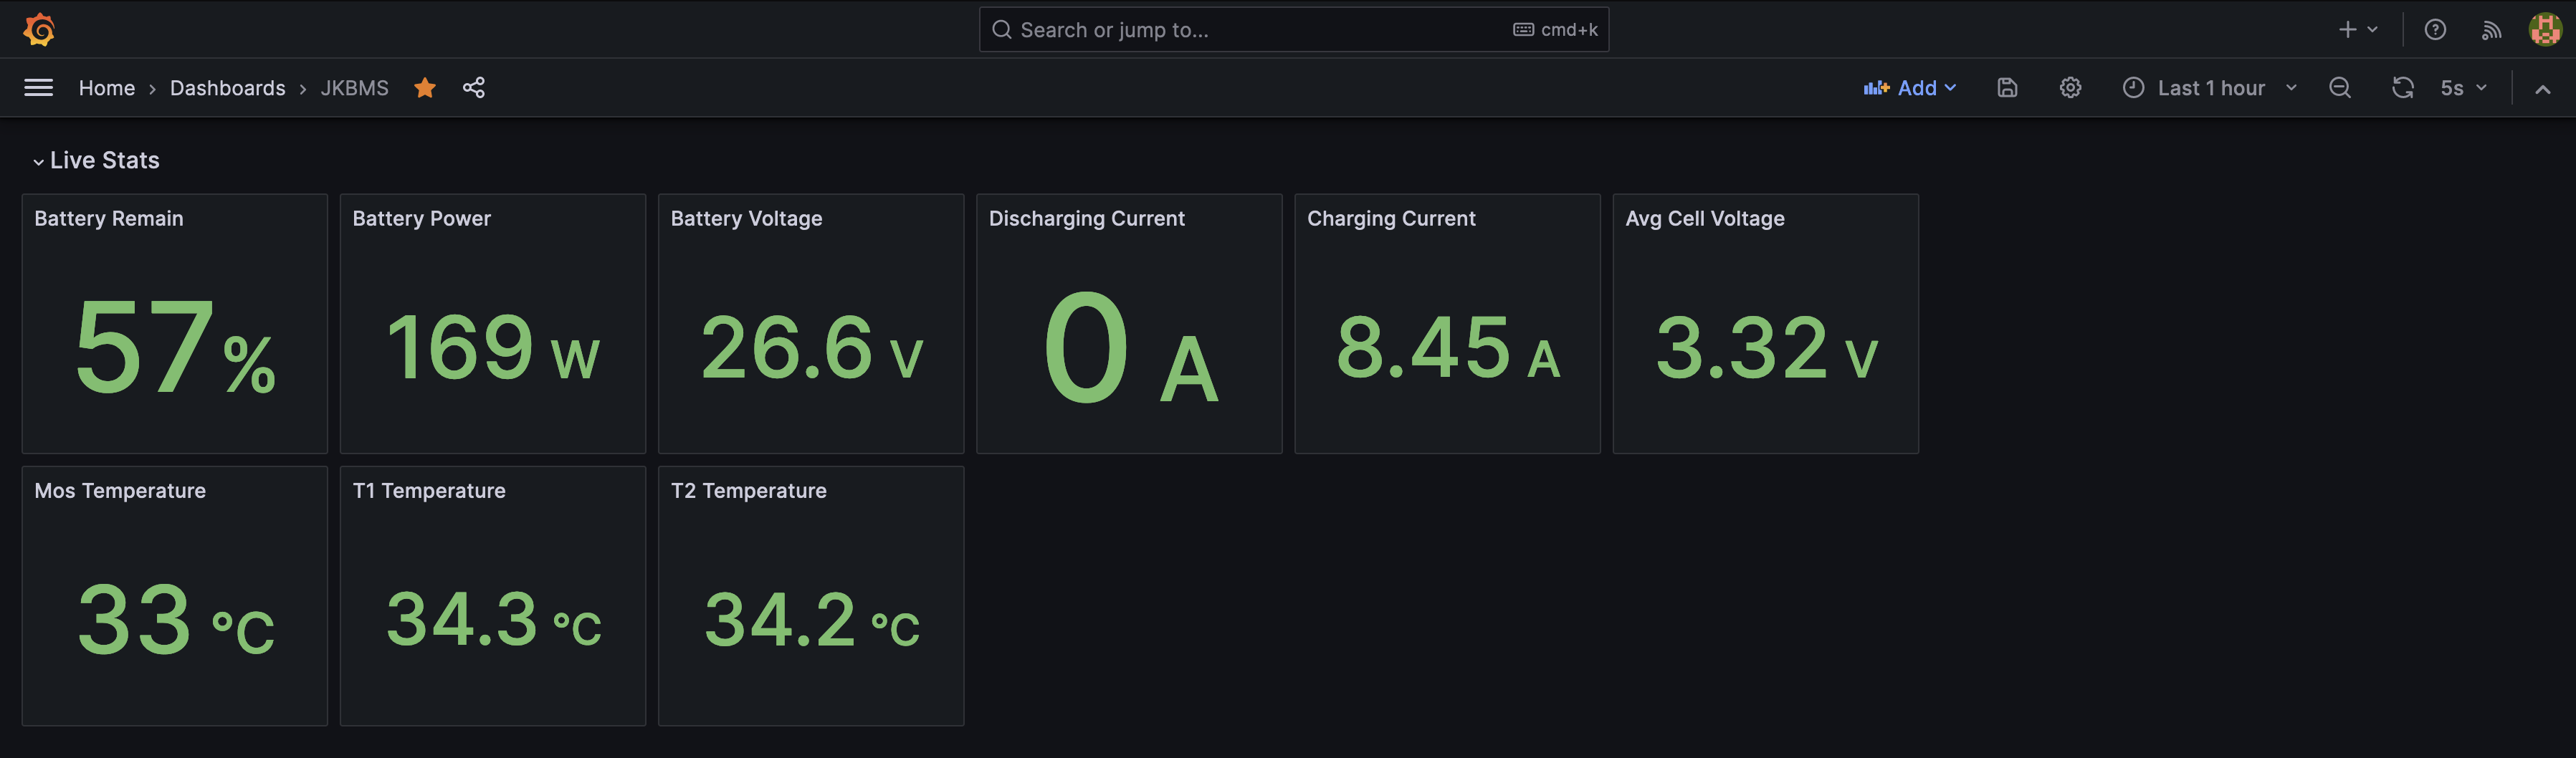
Similarly, you have the option to incorporate multiple visualizations based on battery parameters. In my current dashboard setup, I’ve included the following, displaying real-time values of the configured parameters. Additionally, you can generate historical visualization graphs as needed.
Access Dashboard Form Anywhere Securely
While Grafana offers powerful visualization capabilities, accessing dashboards remotely can be challenging. The traditional way is to configure port forwarding on the home router and that comes with security risks and complexity, especially for users with dynamic IP addresses. Additionally, exposing Grafana directly to the internet without proper security measures can leave it vulnerable to attacks.
Introducing Cloudflare Tunnel
Cloudflare Tunnel addresses these challenges by providing a secure way to expose your local web application or service to the internet. It works by creating a secure connection between your origin server and Cloudflare’s edge network, bypassing firewalls and network restrictions. This ensures that your Grafana dashboard remains protected while allowing authorized users to access it from anywhere.
Create & Configure Cloudflare Tunnel
Integrating Cloudflare Tunnel with Grafana is straightforward and requires just a few steps:
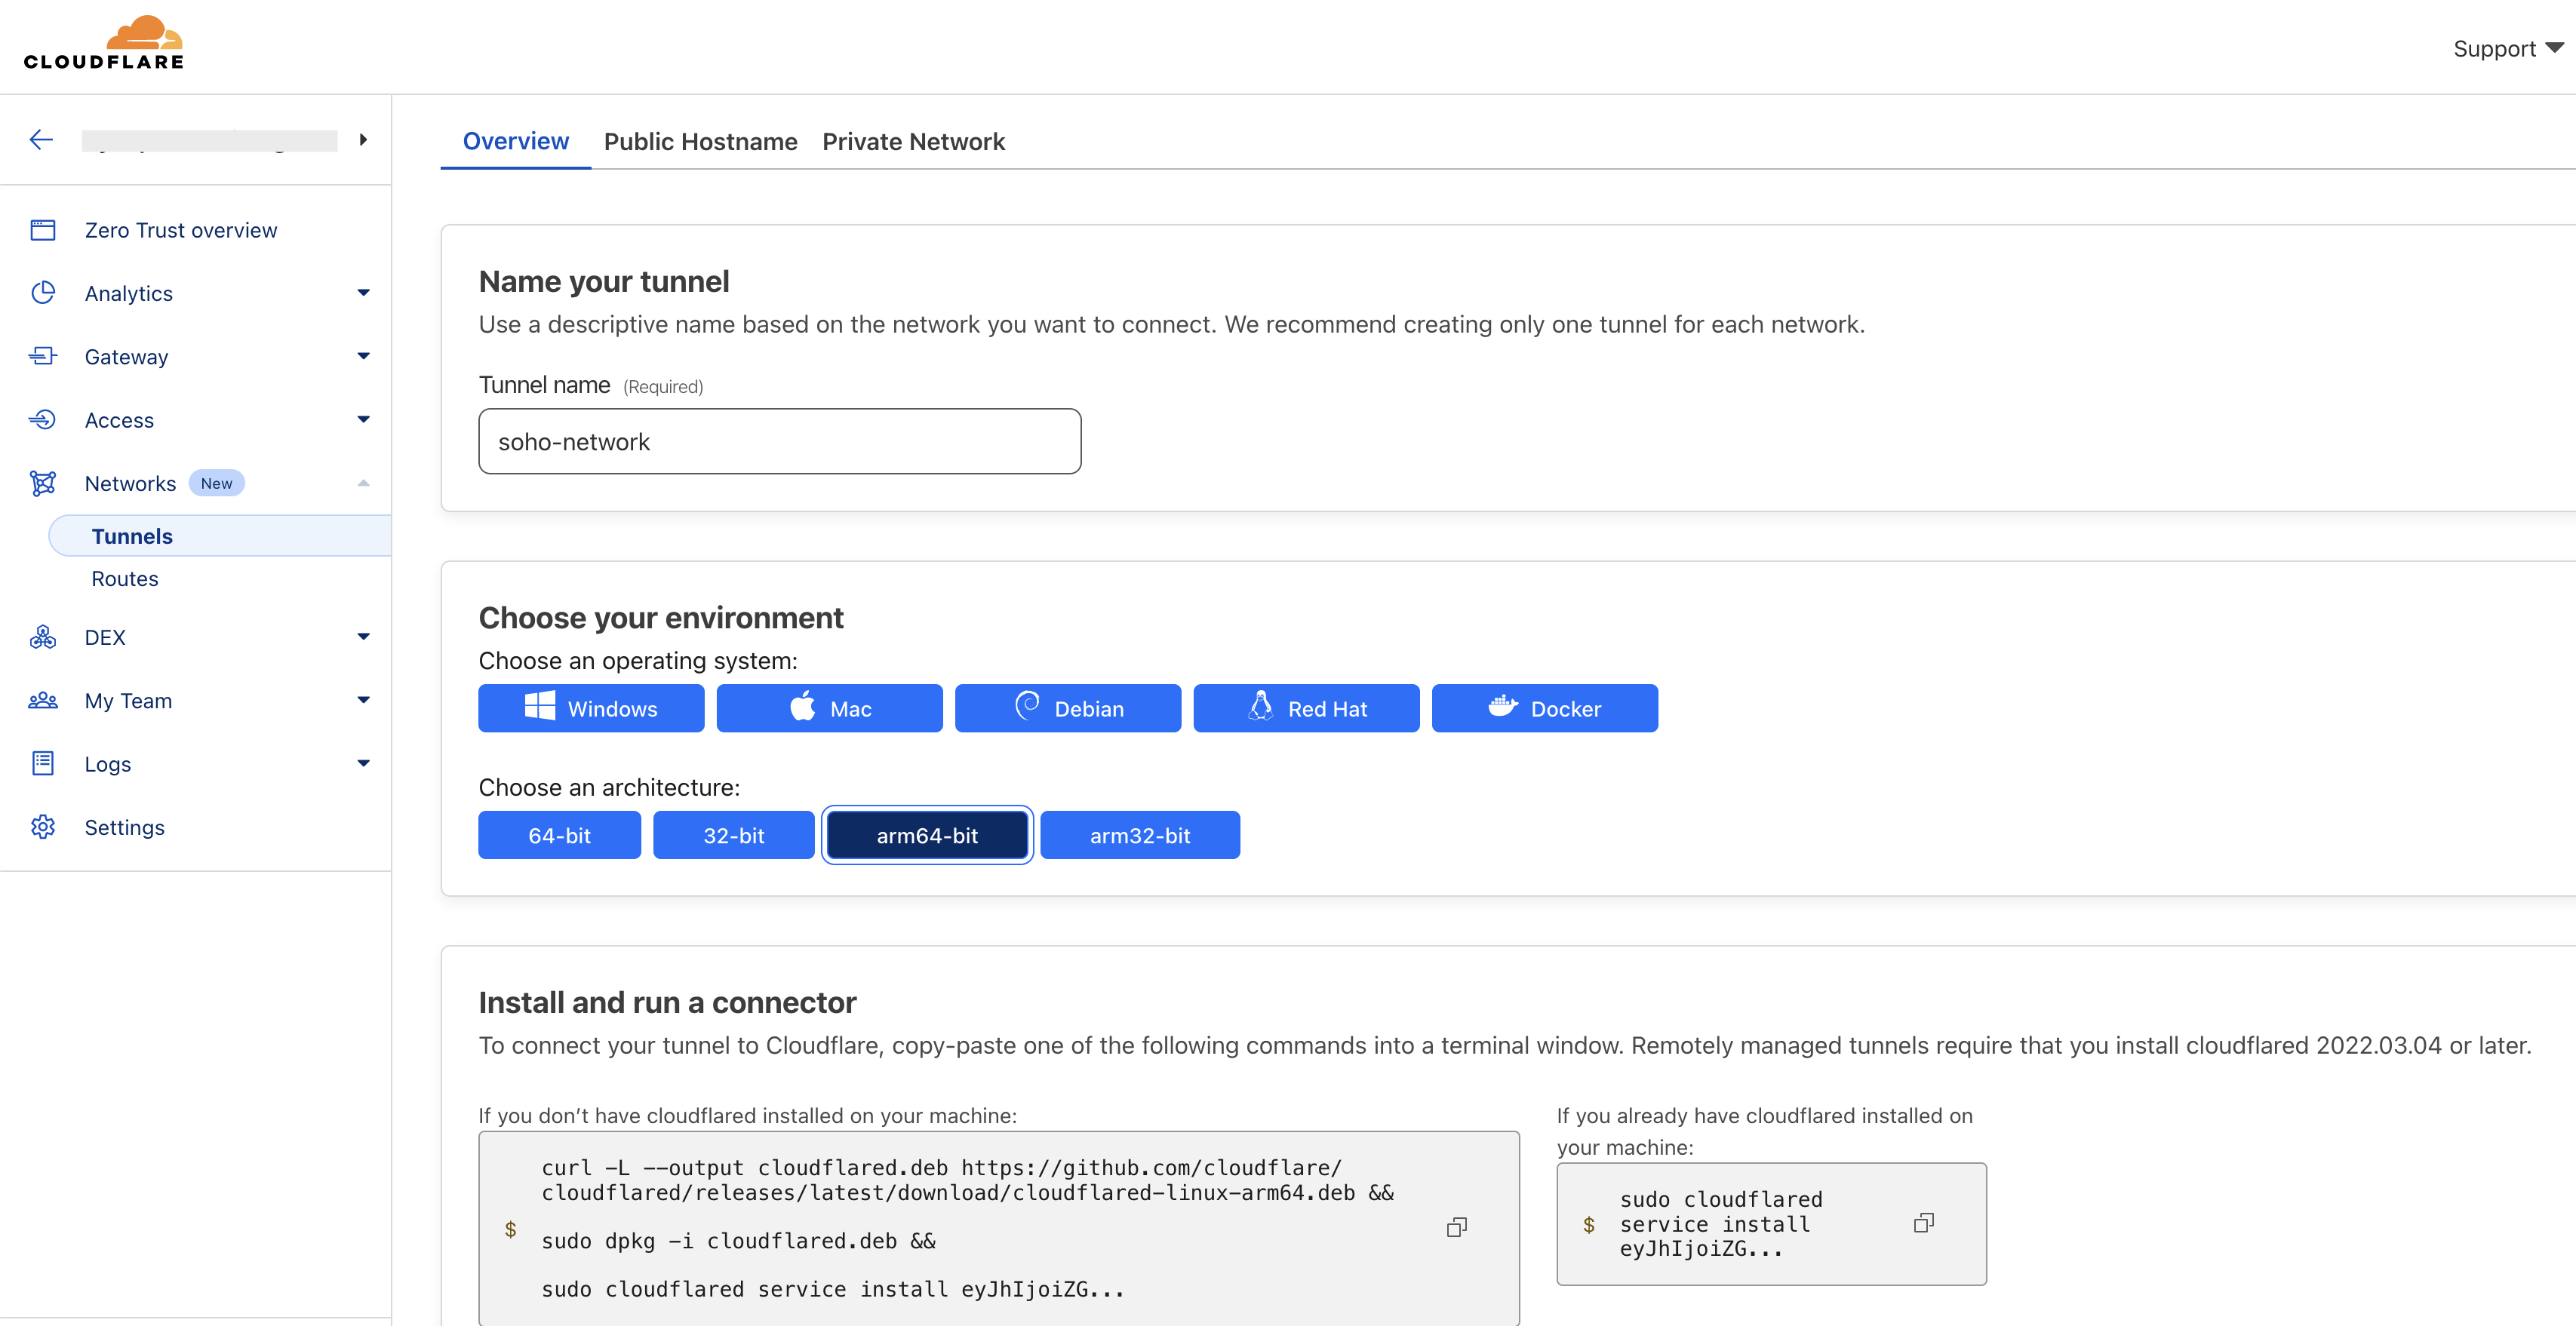
Create a Cloudflare Tunnel: The Cloudflare tunnel feature is located at the Zero Trust section and by navigating to that you can start to create a tunnel by giving a name and connector type as “Cloudflared”.
Install Cloudflare Tunnel: Copy-paste one of the given commands into a terminal window in the Raspberry Pi where your Grafana is hosted. Then that client establishes a secure connection to Cloudflare’s network.
Configure Tunnel: Once installed, navigate to the “Public Hostname” section and configure the Cloudflare Tunnel with the necessary settings, including the hostname and port of your local Grafana server.
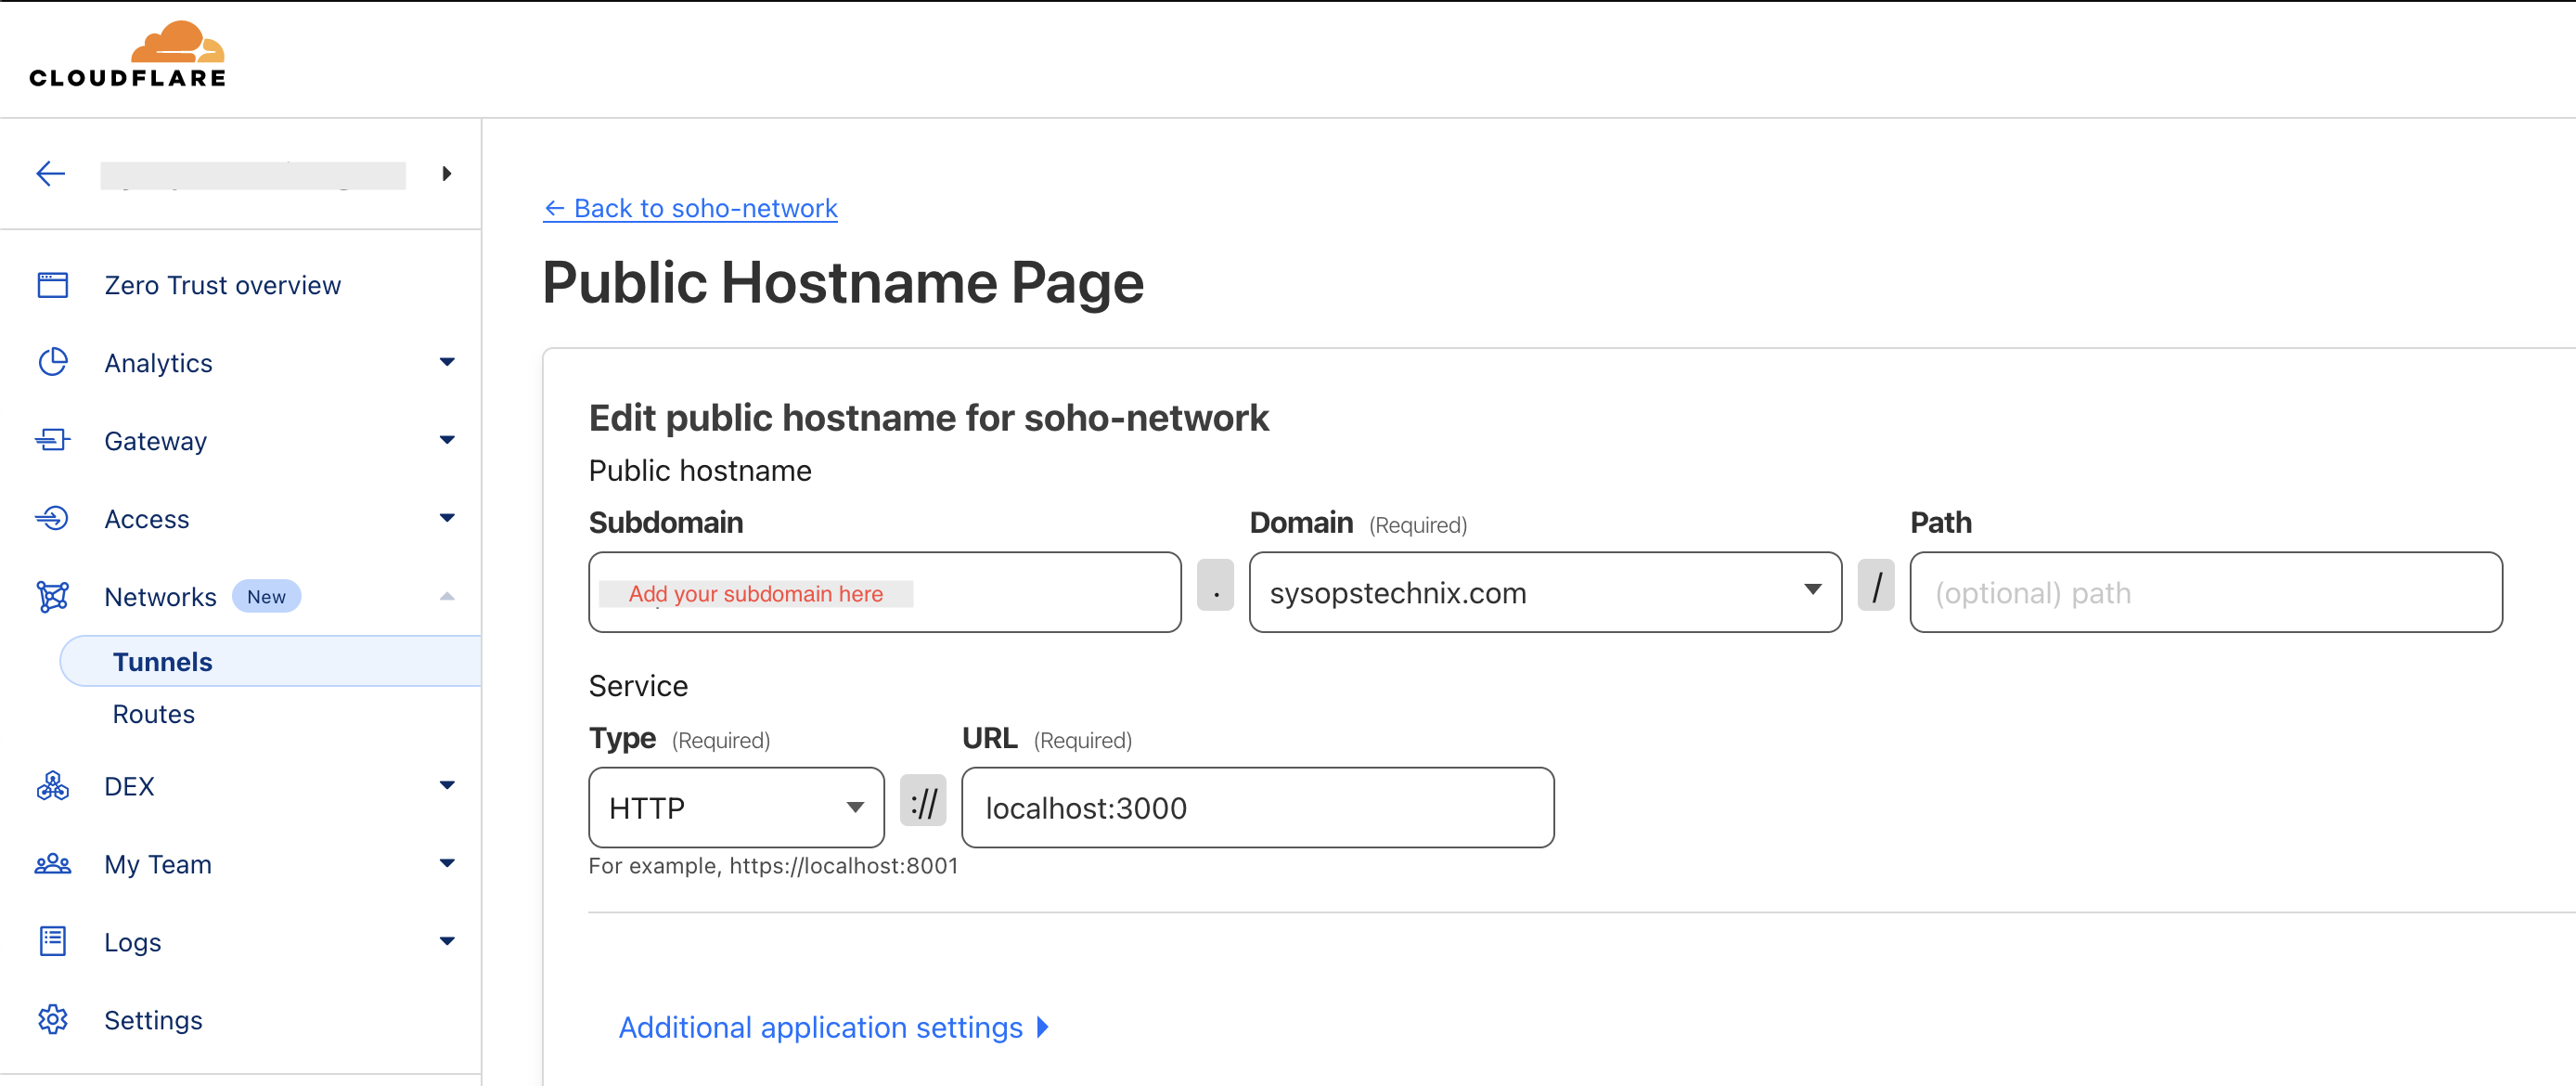
Access Grafana Anywhere: With the Cloudflare Tunnel in place, you can now access your Grafana dashboard securely from anywhere using the assigned Cloudflare hostname.
To delve deeper into Cloudflare Tunnel, you can refer to my previous article titled 4 Steps to Securely Access Home Network Remotely from Anywhere
Cast with Google Nest Hub Smart Displays
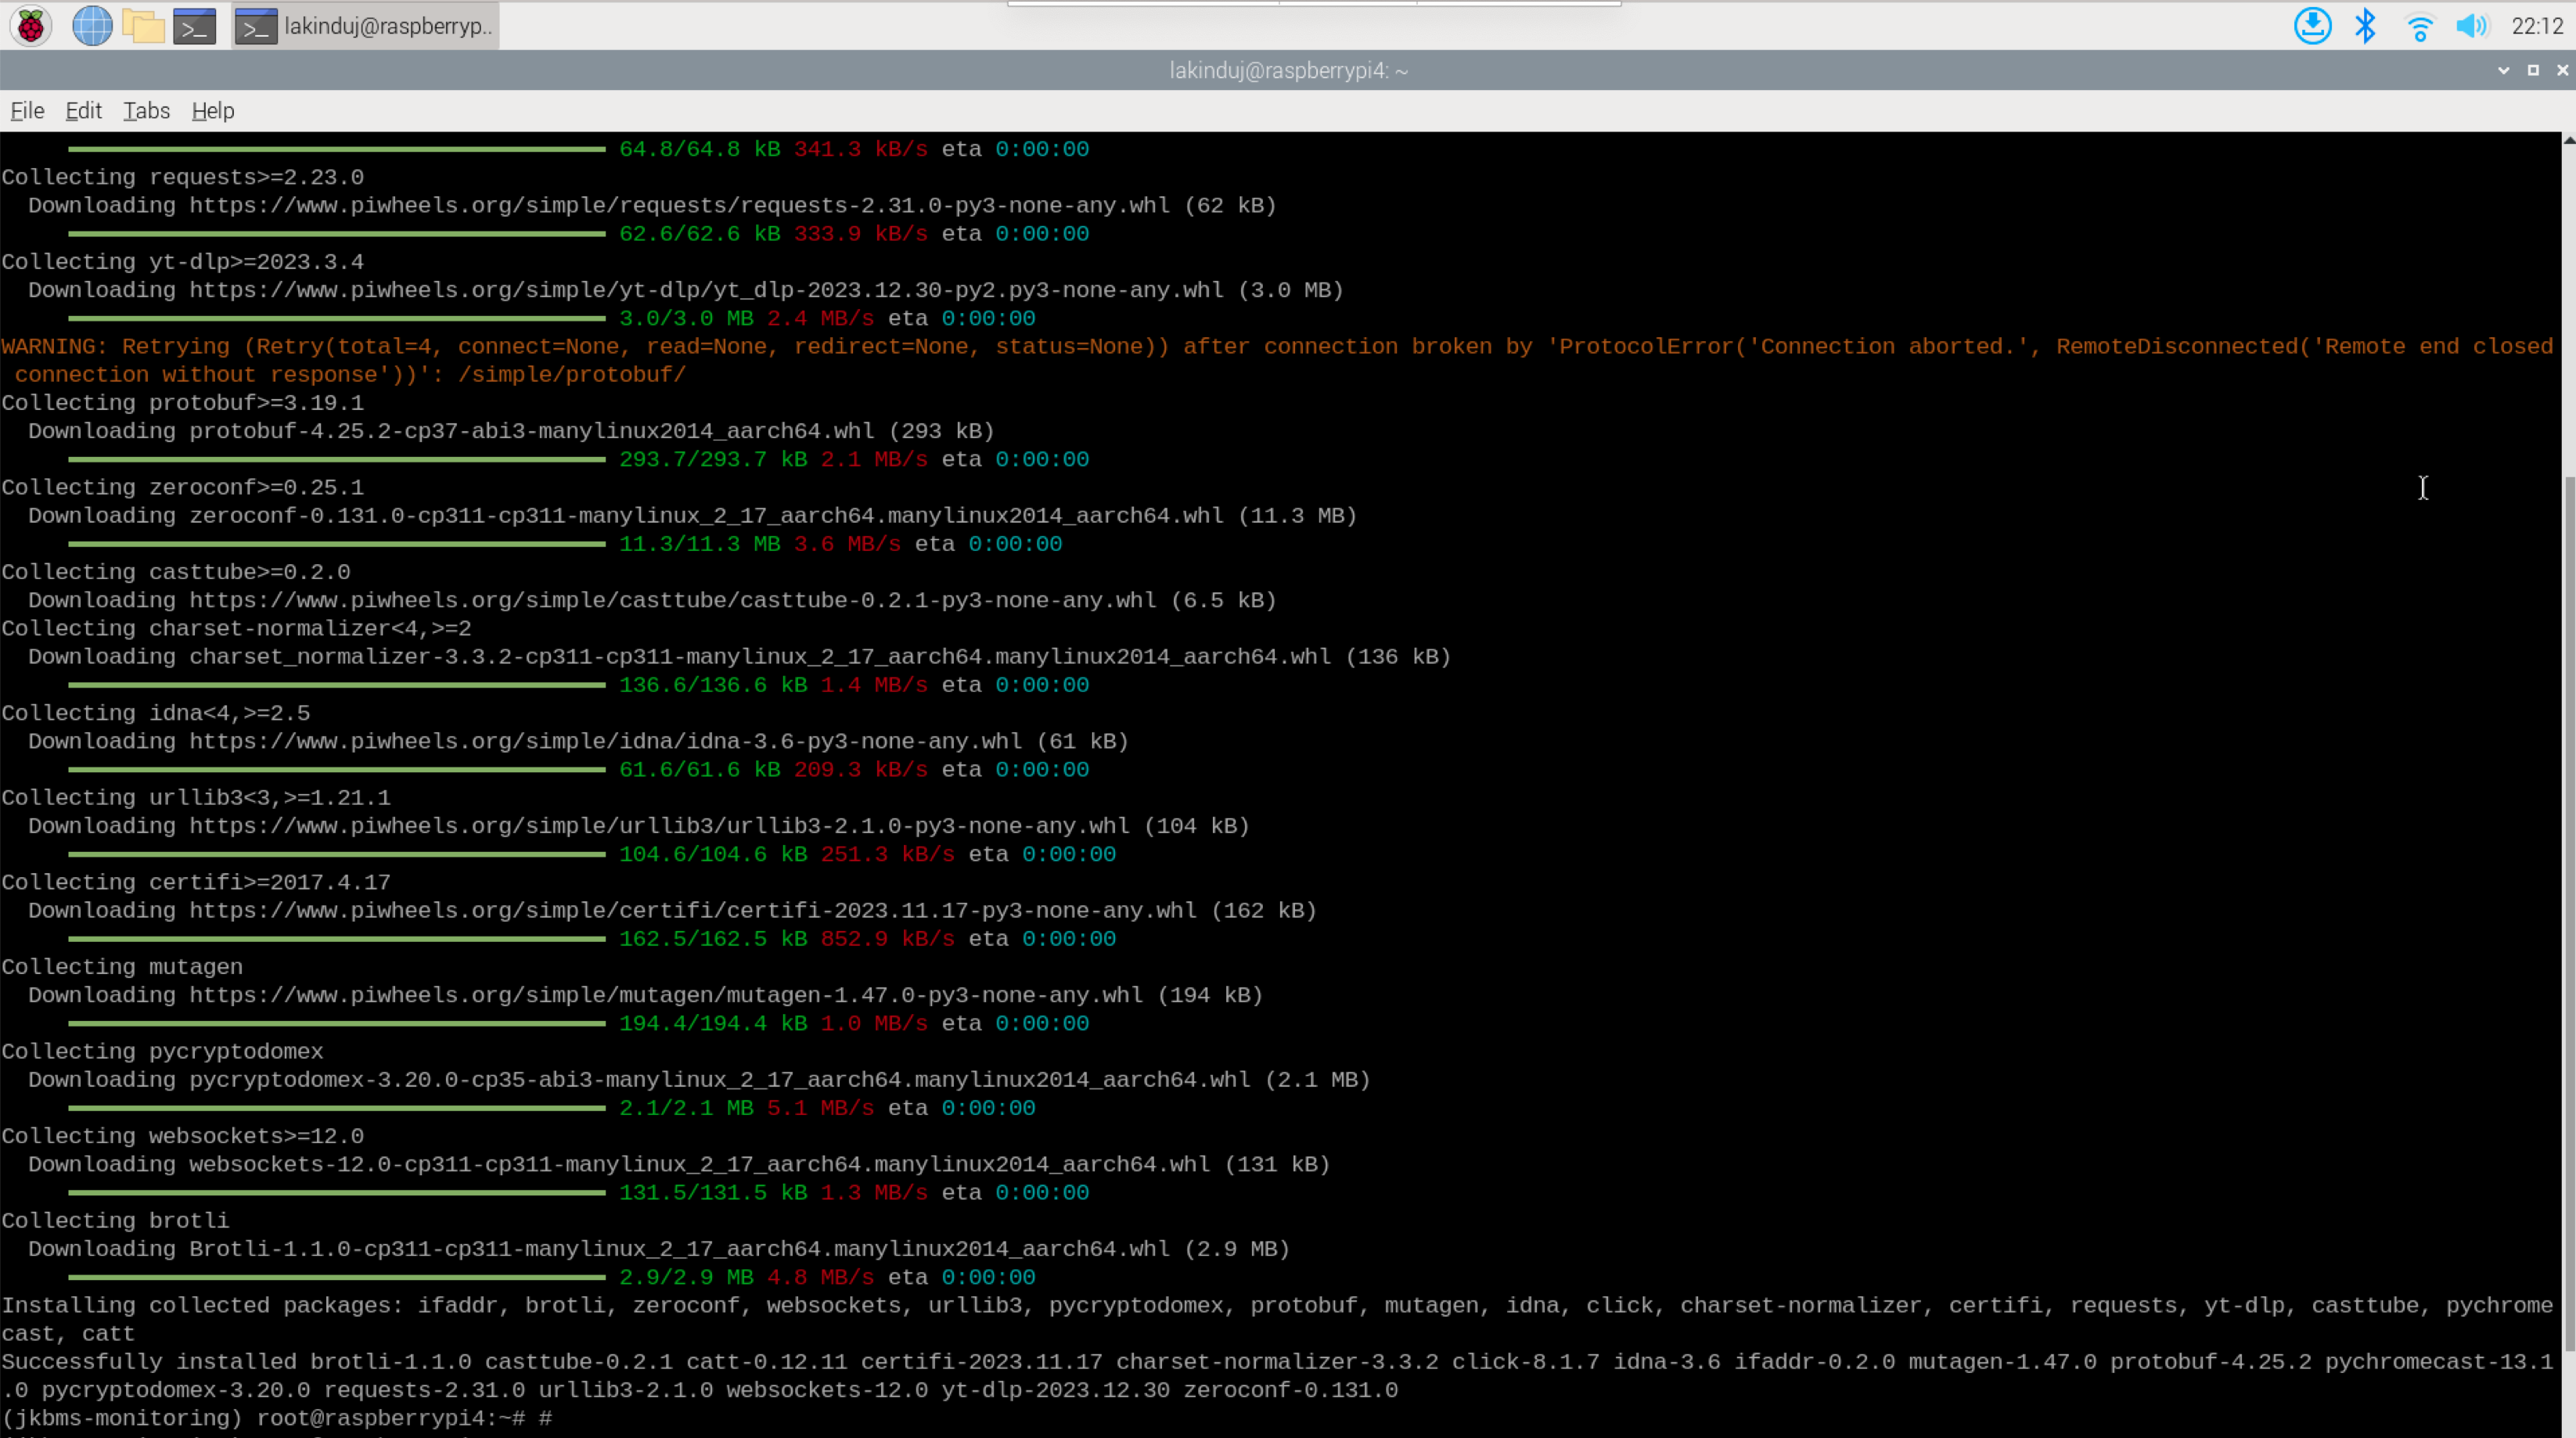
Before diving into the casting process, it’s required to set up the necessary environment. This involves installing the catt Python plugin, which provides a convenient interface for interacting with Chromecast devices, including the Google Nest Hub. Using pip, you can easily install catt with a single command:
source jkbms-monitoring/bin/activate
pip install catt
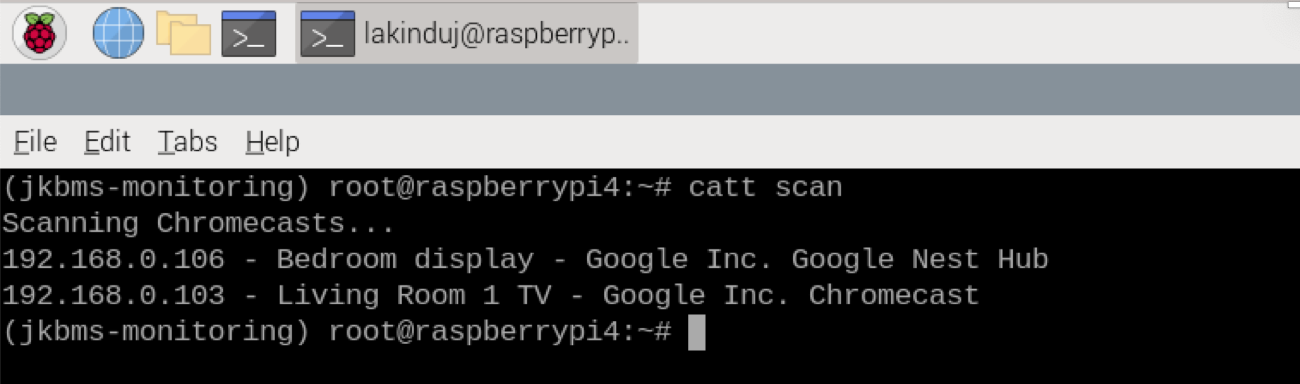
Once installed, you can discover Google Nest Hub on the network using the "catt scan" command, which lists all available Chromecast devices.
catt scan
With the environment configured, casting the Grafana dashboard (make sure to generate a shareable link of your Grafana dashboard) to Google Nest Hub becomes a straightforward task.
catt -d "Bedroom display" cast_site http://192.168.0.105:3000/public-dashboards/157ace0e386d40f2a27b31b038c033b3
Conclusion
JIKONG’s Bluetooth-enabled Smart BMS represents a strategic choice for those seeking efficient and reliable energy management solutions. That offers a comprehensive suite of features designed to maximize the performance, longevity, and safety of battery systems. Utilizing the mpp-solar python package, it enables you to effortlessly monitor your battery system’s status from anywhere over the Internet.
2 comments
Could you provide link to python code for data population into DB?
Can I do this without BT? I have a pi and ran through all the steps, just used /dev/ttyUSB0 which is a usb to rs485 adapter plugged into one of the battery monitor ports of the BMS, but I get:
jkbms -p /dev/ttyUSB_EG4 -P JK02 -c getInfo
2025-11-01 15:45:44,924:ERROR:device:run_command@108: Failed to decode response for command getInfo: index out of range
Command: Unknown command – No description found
——————————————————————————–
Parameter Value Unit
error Failed to decode response for command getInfo: index out of range
——————————————————————————–