
In today’s digital landscape, Wi-Fi analytics play an important role in optimizing network performance and user experience. Cisco Meraki, a leader in cloud-managed networking, provides a powerful cloud-based networking solution with an extensive API that allows network administrators to automate their tasks and gather useful insights.
Why Track Wi-Fi-Connected Users?
Tracking Wi-Fi-connected users in an organization is essential for several reasons, including emergency response planning, regulatory compliance, resource allocation, etc.
In this article, we’ll explore how to use the Cisco Meraki API to retrieve the WiFi-connected user count, along with step-by-step implementation guidance.
Prerequisites for Using the Cisco Meraki API
Before accessing the Cisco Meraki API, ensure you have the following:
- Admin access to the Cisco Meraki Dashboard
- An API key with necessary permissions
- Network ID of your network
- Programming Environment with Python
Enabling API Access in Meraki Dashboard
Log in to your Meraki Dashboard, go to Organization > API & Webhooks, and navigate to the API Keys and Access section. Then, click Generate API Key to create a new key.

Try out the Meraki API via Terminal
After obtaining the API key from the Meraki Dashboard, you can test it using the curl command. For more information about the Meraki API, refer to the Meraki Dashboard API documentation.
The Meraki API Base URI
In most parts of the world, every API request will begin with the following base URI:
https://api.meraki.com/api/v1
Find your Organization ID & Network ID
To start using the API, you’ll first need your organization ID and the Network ID, which are required for any operation that uses the organizationId parameter.
#Get the Organization ID
curl https://api.meraki.com/api/v1/organizations \
  -L -H 'Authorization: Bearer {MERAKI-API-KEY}'

#Get the Network ID by providing organizationId
curl https://api.meraki.com/api/v1/organizations/{organizationId}/networks \
  -L -H 'Authorization: Bearer {MERAKI-API-KEY}'
Prepare Meraki API Endpoint
Let’s create the Meraki API full URI to retrieve the connected client data.
curl --location 'https://api.meraki.com/api/v1/networks/{networkId}/clients?timespan=7200&perPage=1000' \
--header 'Accept: application/json' \
--header 'Authorization: Bearer {MERAKI-API-KEY}'

Retrieving WiFi-Connected Users Count Using the Meraki API
Simple Architecture

Prepare the Programming Environment
Creating a Python virtual environment is a good practice to manage dependencies and avoid conflicts between different projects. Here are the steps to create and use a virtual environment:
#Install some prerequisites
apt install python3-pip python3.8-venv

#Install virtualenv if you don't have it already
pip install virtualenv

#Create a Virtual Environment
python -m venv meraki-wifi-user-count

#Move to the directroy
cd /root/meraki-wifi-user-count

#Activate the Virtual Environment
source bin/activate

#Install the required python packages for Meraki API access & etc.
pip install requests influxdb-client
Below is a Python script that retrieves and counts the WiFi-connected users in the last 2 hours. You’ll need to replace API_KEY, NETWORK_ID, and SSID_NUMBER with your actual Meraki API key, network ID, and SSID number, respectively.
Open a new file app.py inside your virtual environment.
import requests
from datetime import datetime, timedelta
# Your Meraki API key
API_KEY = 'YOUR_API_KEY'
# Network ID of the Wi-Fi network you are interested in
NETWORK_ID = 'YOUR_NETWORK_ID'
# SSID of the Wi-Fi network
SSID_NAME = 'YOUR_SSID_NAME'
# Base URL for Meraki Dashboard API
BASE_URL = 'https://api.meraki.com/api/v1'
# Headers for the API request
headers = {
'X-Cisco-Meraki-API-Key': API_KEY,
'Content-Type': 'application/json'
}
def get_clients_connected(network_id, ssid_name):
url = f'{BASE_URL}/networks/{network_id}/clients'
params = {
'timespan': 7200, # 2 hours in seconds
'perPage': 1000 # Maximum number of clients per page
}
response = requests.get(url, headers=headers, params=params)
response.raise_for_status()
clients = response.json()
# Filter clients connected to the specific SSID
ssid_clients = [client for client in clients if client.get('ssid', -1) == ssid_name]
return len(ssid_clients)
# Get the number of clients connected in the last 2 hours
client_count = get_clients_connected(NETWORK_ID, SSID_NAME)
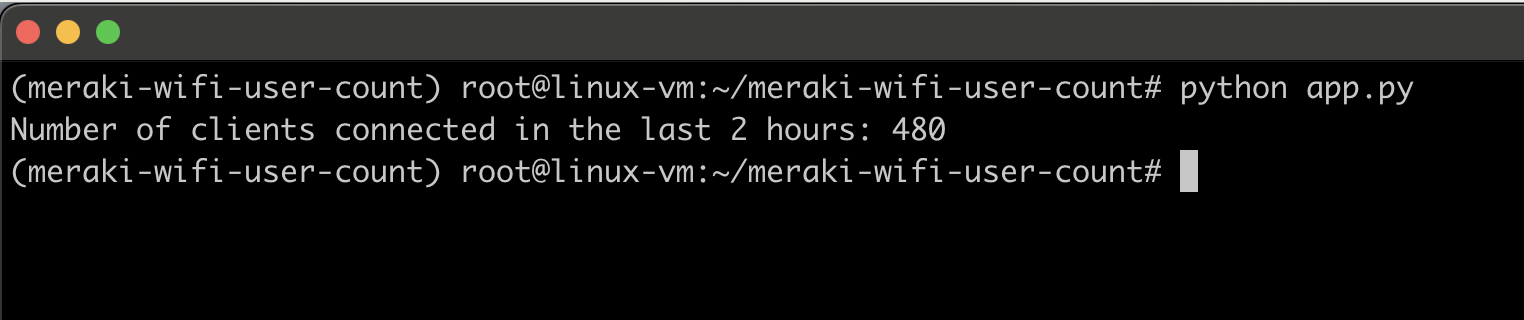
print(f'Number of clients connected in the last 2 hours: {client_count}')
Once you are done with the above script, you can run it using the command python app.py command and you can see the output as follows. Make sure you have the necessary permissions on your API key to access the required endpoints and resources in the Meraki Dashboard API.
Let’s Visualize Data on a Grafana
To make the application easily accessible and efficient, I will collect and store the data in InfluxDB, a high-performance time-series database. For visualization, I will use Grafana to create interactive and customizable dashboards, allowing users to explore and analyze the collected data through clear and insightful graphs via a web-based interface.
Install InfluxDB 2.x
On Ubuntu/Debian-based OS:
#Install the required repositories and GPG keys
curl -s https://repos.influxdata.com/influxdata-archive.key | sudo gpg --dearmor -o /usr/share/keyrings/influxdb-archive-keyring.gpg

echo "deb [signed-by=/usr/share/keyrings/influxdb-archive-keyring.gpg] https://repos.influxdata.com/debian stable main" | sudo tee /etc/apt/sources.list.d/influxdb.list

#Install the influxdb2
apt update
apt install influxdb2

#Enable and start the influxdb service
systemctl enable --now influxdb
systemctl status influxdb
Configure the InfluxDB
Open your web browser and go to: http://<your_server_ip>:8086. The InfluxDB setup screen will appear—follow the prompts to complete the initial user configuration.

Make sure to copy this token and save it – it’s used in your Python app.

Modify the Python App
Modify your Python application script (app.py) to store the WiFi client count as a time series in InfluxDB.
Update your Python script with the following InfluxDB configuration:
# === INFLUXDB CONFIG ===
INFLUX_URL = "http://localhost:8086"
INFLUX_TOKEN = "KWAGiKjMzDa_iFCefB6h_aKtRgnNQCUZPOWxsvrNyYPDO6qSeYYHa59WrnSm81w"
INFLUX_ORG = "meraki_org"
INFLUX_BUCKET = "meraki_wifi_user_count"
Here is the final app.py Python script to retrieve data from the Meraki API and write it to InfluxDB.
import requests
from datetime import datetime, timezone
from influxdb_client import InfluxDBClient, Point, WriteOptions

# === MERAKI CONFIG ===
API_KEY = 'YOUR_API_KEY'
NETWORK_ID = 'YOUR_NETWORK_ID'
SSID_NAME = 'YOUR_SSID_NAME'
BASE_URL = 'https://api.meraki.com/api/v1'

# === INFLUXDB CONFIG ===
INFLUX_URL = "http://localhost:8086"
INFLUX_TOKEN = "KWAGiKjMzDa_iFCefB6h_aKtRgnNQCUZPOWxsvrNyYPDO6qSeYYHa59WrnSm81w"
INFLUX_ORG = "meraki_org"
INFLUX_BUCKET = "meraki_wifi_user_count"

# === INIT INFLUXDB ===
influx = InfluxDBClient(url=INFLUX_URL, token=INFLUX_TOKEN, org=INFLUX_ORG)
write_api = influx.write_api(write_options=WriteOptions(batch_size=1))

# Headers for the API request
headers = {
    'X-Cisco-Meraki-API-Key': API_KEY,
    'Content-Type': 'application/json'
}

def get_clients_connected(network_id, ssid_name):
    url = f'{BASE_URL}/networks/{network_id}/clients'
    params = {
        'timespan': 3600,  # 1 hours in seconds
        'perPage': 1000    # Maximum number of clients per page
    }
    response = requests.get(url, headers=headers, params=params)
    response.raise_for_status()

    clients = response.json()

    # Filter clients connected to the specific SSID
    ssid_clients = [client for client in clients if client.get('ssid', -1) == ssid_name]

    return len(ssid_clients)

def log_to_influx(ssid_name, count):
    point = Point("wifi_clients") \
        .tag("ssid", ssid_name) \
        .field("count", count) \
        .time(datetime.now(timezone.utc))

    write_api.write(bucket=INFLUX_BUCKET, org=INFLUX_ORG, record=point)
    print(f"[✓] Logged {count} clients for SSID '{ssid_name}' to InfluxDB")

if __name__ == "__main__":
    try:
        count = get_clients_connected(NETWORK_ID, SSID_NAME)
        log_to_influx(SSID_NAME, count)
    except Exception as e:
        print(f"[!] Error: {e}")
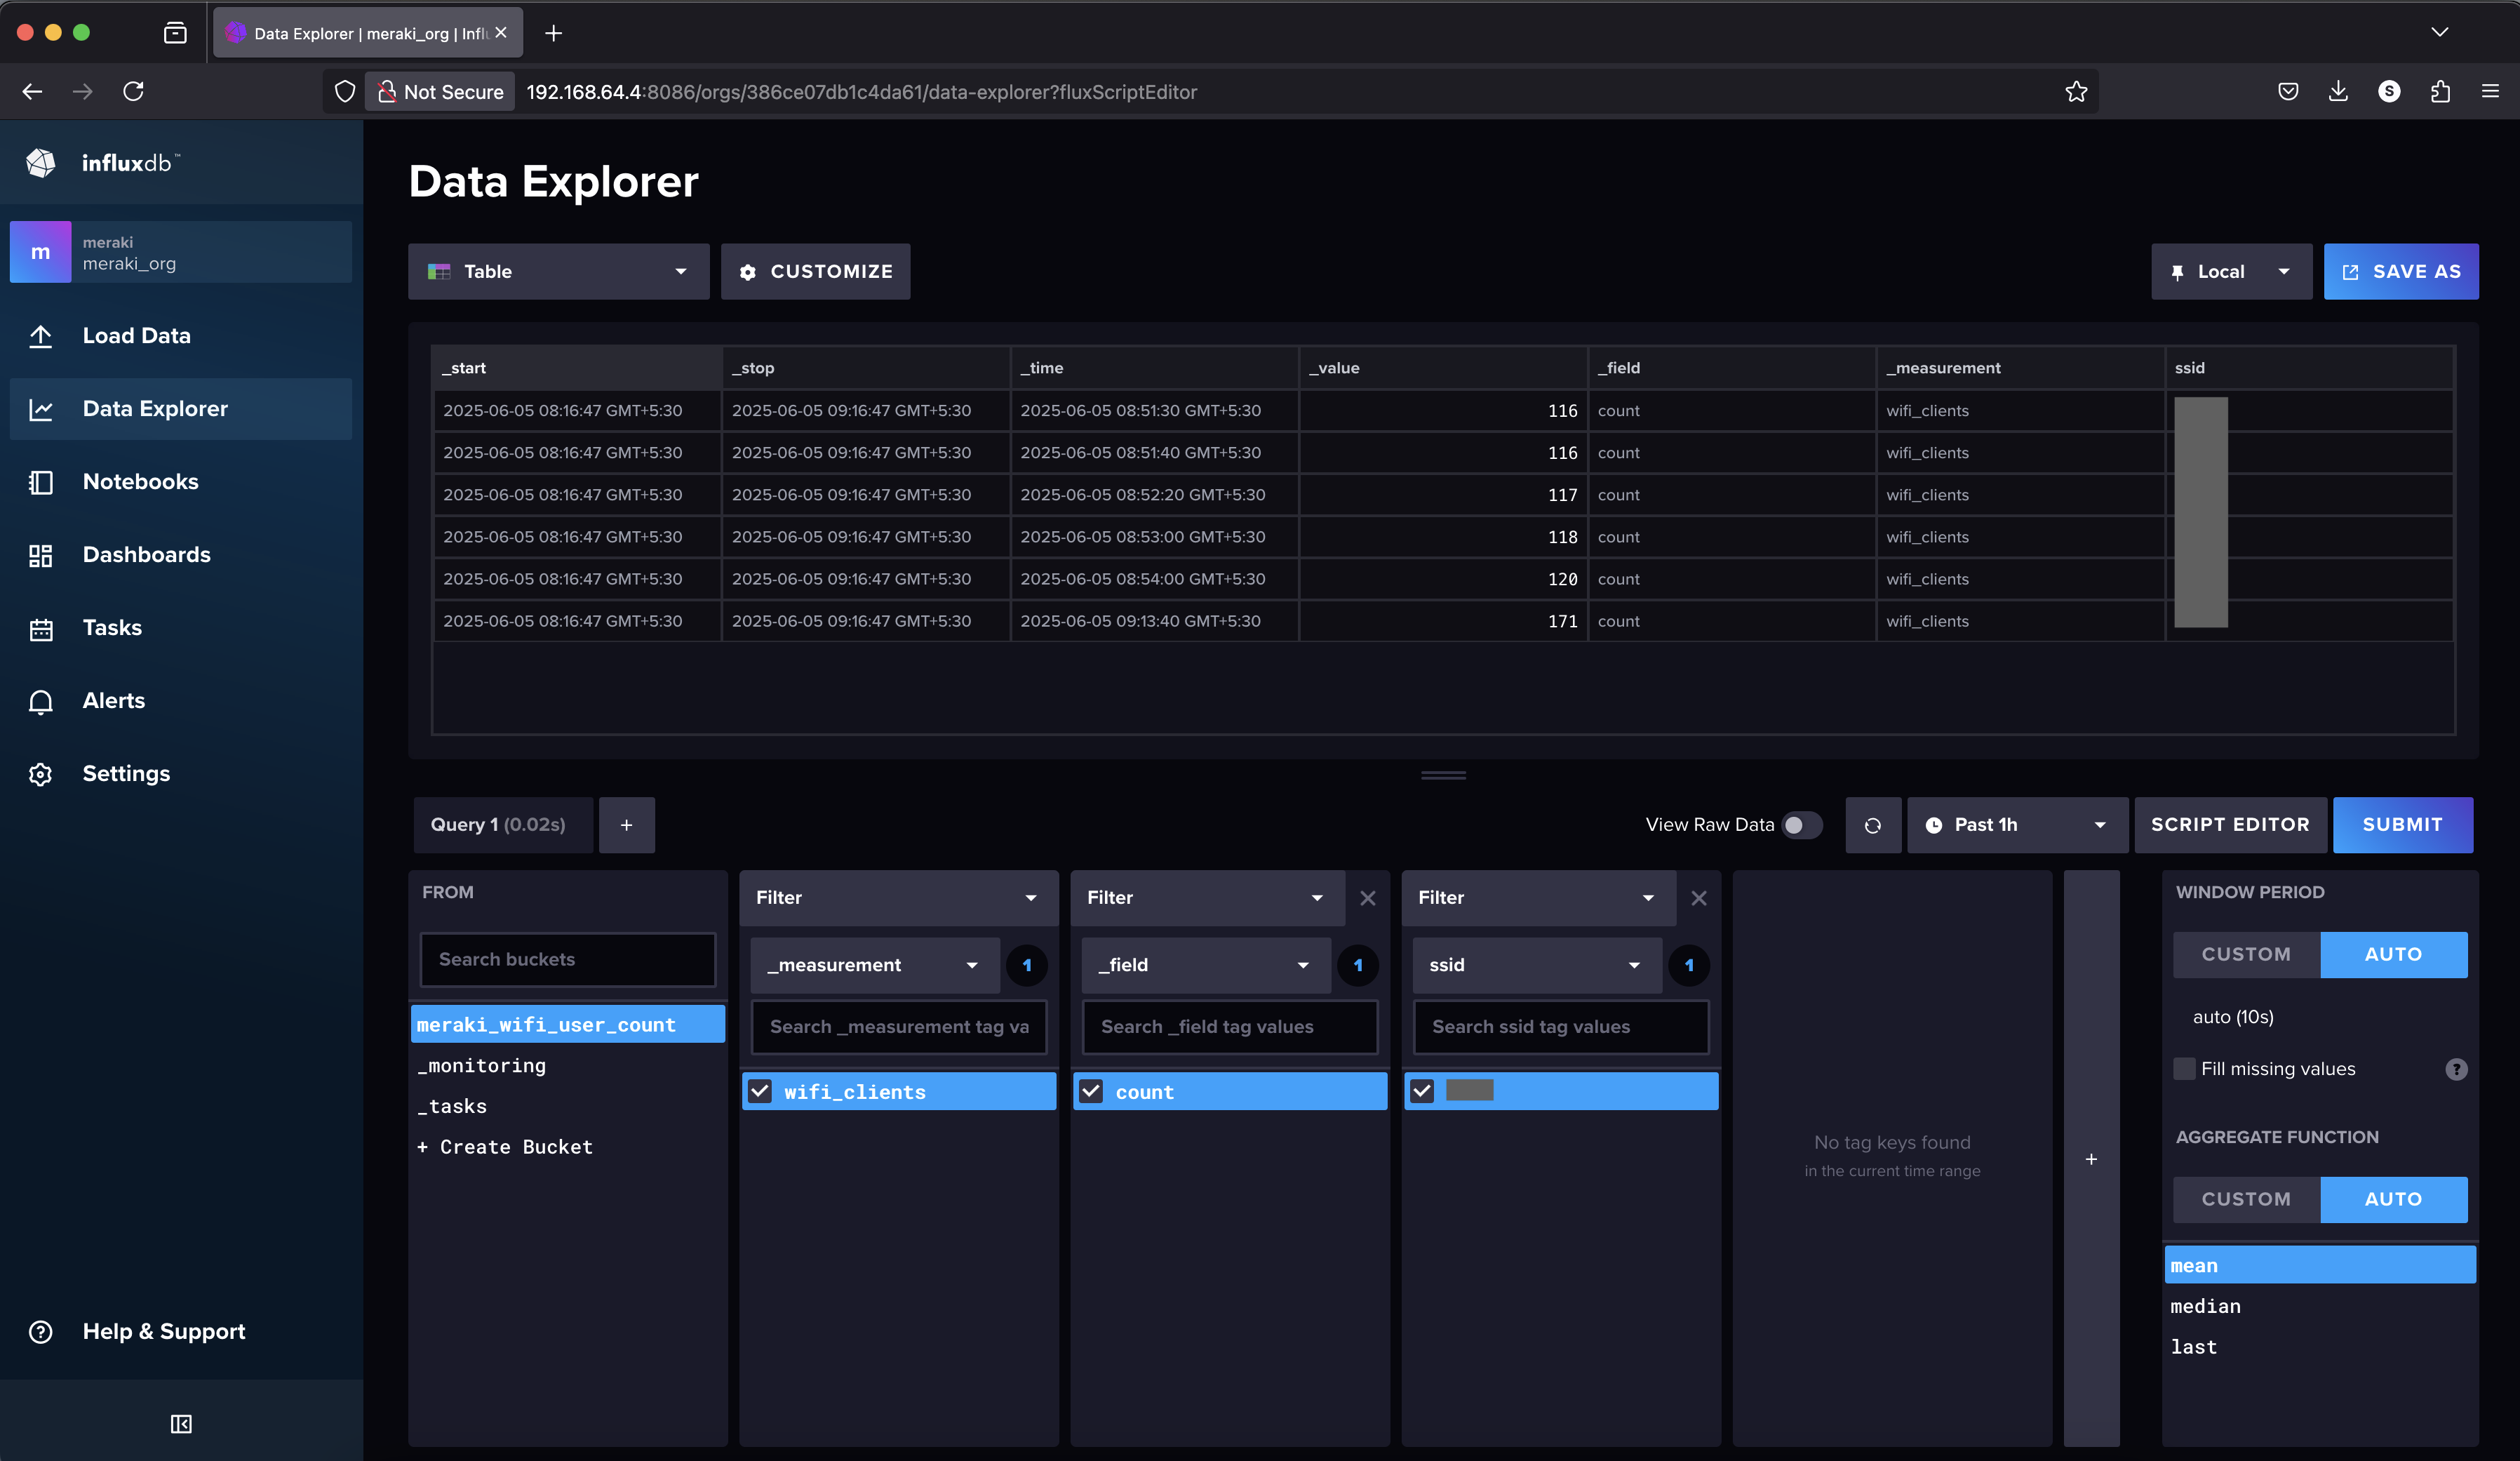
As before, you can run this Python script to check if data is being sent to InfluxDB. If you’re using the InfluxDB Web UI, go to the Data Explorer, select the appropriate bucket, and click ‘Submit‘. You should see a time series data along with the raw data values.
Schedule the App to Run Periodically
Next, we’ll set up the script to run periodically (every 5mins), so it continuously populates the InfluxDB bucket. We’ll create a cron job to run the Python script every hour, making sure it uses the Python interpreter from your virtual environment.
crontab -e
*/5 * * * * /root/meraki-wifi-user-count/bin/python /root/meraki-wifi-user-count/app.py >> /root/meraki-wifi-user-count/app.log 2>&1
Install & Configure Grafana
Let’s install and configure Grafana to visualize Meraki WiFi client data stored in InfluxDB.
On Ubuntu/Debian-based OS:
#Install the required repositories and GPG keys
apt install -y software-properties-common
add-apt-repository "deb https://packages.grafana.com/oss/deb stable main"
apt-key adv --keyserver keyserver.ubuntu.com --recv-keys 963FA27710458545
wget -q -O - https://packages.grafana.com/gpg.key | sudo apt-key add -

#Install the Grafana
apt update
apt install grafana

#Enable & Start the grafana-server
systemctl enable grafana-server
systemctl start grafana-server
Open your browser and go to: http://<your_server_ip>:3000. Give the default username and password as “admin”.
Add InfluxDB as a Data Source
Navigate to the Data Sources > Add data source and choose InfluxDB. Fill in the InfluxDB details accordingly and Click Save & Test — it should say “Data source is working”.
For InfluxDB v2:
- Query Language:
Flux - URL:
http://localhost:8086(or your InfluxDB server IP) - Organization:
meraki_org - Token: your InfluxDB API token
- Default Bucket:
meraki_wifi_user_count

Create a Dashboard & Panel
Navigate to the dashboard section and create a new dashboard.
In the query editor choose the data source (InfluxDB), then use the following Flux query:
from(bucket: "meraki_wifi_user_count")
  |> range(start: -2w)
  |> filter(fn: (r) => r._measurement == "wifi_clients")
  |> filter(fn: (r) => r._field == "count")
  |> aggregateWindow(every: 5m, fn: mean)
  |> yield(name: "mean")
Finally, you can customize the graph accordingly.

For more details on configuring InfluxDB with Grafana, refer to my JKBMS Monitoring post.
Conclusion
Using the Cisco Meraki API, you can efficiently retrieve the count of WiFi-connected users to monitor network performance and usage. This data can be integrated into dashboards for better network visibility and management. With the right security practices and efficient API usage, network administrators can automate and optimize network monitoring.